
 Yahoo Finance
 E-mini NASDAQ Counter-Trend Buyers Trying to Overtake 14144
March E-mini NASDAQ-100 Index futures are down sharply shortly after the mid-session on Monday as the prospect of a Russian invasion of Ukraine compounded problems for investors already worried about aggressive monetary policy tightening by the U.S. Federal Reserve.
At 18:48 GMT, March E-mini NASDAQ-100 index futures are trading 14090.50, down 336.00 or -2.33%. This is up from an intraday low of 13706.00. The Invesco QQQ Trust Series 1 ETF (QQQ) is trading $344.94, down $6.75 or -1.92%.
Reuters reported that NATO said on Monday it was putting forces on standby and reinforcing Eastern Europe with more ships and fighter jets in response to Russia’s military build-up at Ukraine’s borders.
Meanwhile, the Fed’s two-day policy meeting concludes on Wednesday and the market will pay close attention to how worried the Fed is over surging inflation and how aggressive the U.S. central bank will be trying to contain it. Fed funds futures traders are fully pricing in a 25 basis point hike in March, in addition to three more rate increases by year-end.
Daily Swing Chart Technical Analysis
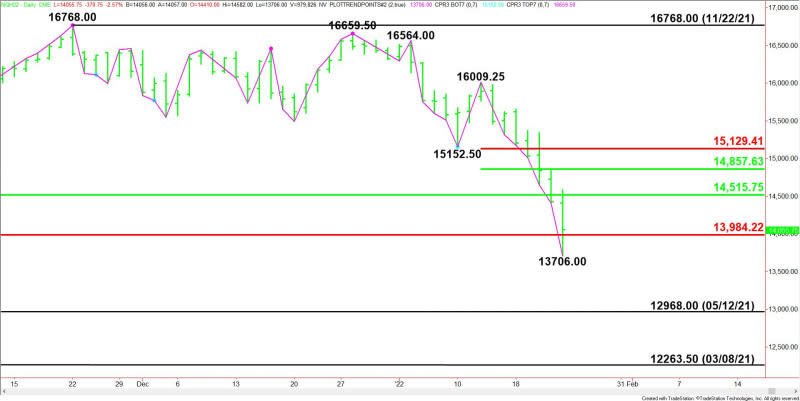
The main trend is down according to the daily swing chart. A trade through the intraday low at 13706.00 will signal a resumption of the downtrend.
A move through 16009.25 will change the main trend to up. This is highly unlikely but due to the prolonged move down in terms of price and time, the index is ripe for a potentially bullish closing price reversal bottom.
The main range is 12663.00 to 16768.00. The index is currently trading inside its retracement zone at 14515.75 to 13984.25.
The minor range is 16009.25 to 13706.00. Its retracement zone at 14857.75 to 15129.50 is the first upside target zone.
Daily Swing Chart Technical Forecast
The direction of the March E-mini NASDAQ-100 Index into the close on Monday is likely to be determined by trader reaction to 13984.25.
Bearish Scenario
A sustained move under 13984.25 will indicate the presence of sellers. This could lead to a retest of the intraday low at 13706.00. Taking out this level could trigger an acceleration to the downside with the May 12, 2021 main bottom at 12968.00 the next likely target.
Bullish Scenario
A sustained move over 13984.25 will signal the presence of buyers. If this creates enough upside momentum late in the session then look for a surge into 14426.50, followed closely by 14515.75.
Taking out 14426.50 will turn the index higher for the session. Overtaking 14515.75 could trigger an acceleration into 14857.75 to 15129.50.
Side Notes
A close over 14426.50 will form a closing price reversal bottom. If confirmed, this could trigger the start of a 2 to 3 day correction.
For a look at all of today’s economic events, check out our economic calendar.
This article was originally posted on FX Empire
