
 Yahoo Finance
 E-mini NASDAQ-100 Index (NQ) Futures Technical Analysis – Could Be Set Up for Short-Term Correction
March E-mini NASDAQ-100 Index futures hit a new record high early in the session on Friday, but ended up finishing lower after profit-takers came in to kill the rally. We’re sticking to our story that profit-taking is behind the weakness although some analysts believe it was a disappointing U.S. jobs report.
Our intraday work shows the index pushed higher after a report showing slower-than-expected U.S. jobs growth in December and that the news was offset by gains in technology stocks.
Technology stocks, the market leaders of the last decade, were on track for the sharpest gains among the 11 main S&P sectors in the first full trading week of 2019.
At 21:42 GMT, March E-mini NASDAQ-100 Index futures are trading 8977.75, down 31.25 or -0.35%.
Daily Swing Chart Technical Analysis
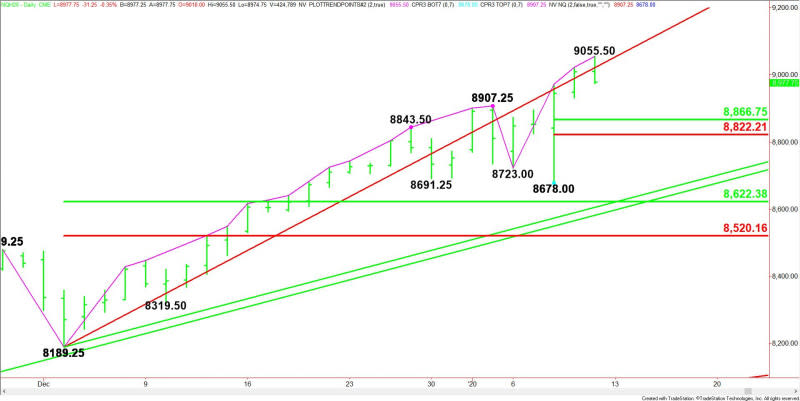
The main trend is up according to the daily swing chart. The uptrend was reaffirmed early in the session when sellers took out the previous day’s high. The main trend will change to down on a move through the last main bottom at 8678.00.
The short-term range is 8678.00 to 9055.50. Its retracement zone at 8866.75 to 8822.25 is the first downside target. Since the main trend is up, look for buyers on a pullback into this area.
The main range is 8189.25 to 9055.50. If the trend changes to down on a move through 8678.00 then look for the selling to possibly extend into its retracement zone at 8622.25 to 8520.00. A move into this zone should attract buyers since it represents value.
Daily Gann Angle Analysis
The key Gann angle on the upside is moving up at a rate of 32 points per day from the 8189.25 main bottom. It came in at 9021.25 early Friday.
A sustained move over 9021.25 would have put the index in an extremely bullish position. Taking it out then breaking back below it indicates the presence of sellers.
The next major uptrending Gann angle targets come in at 8605.25 and 8582.50. This angles are passing through the retracement zone at 8622.25 to 8520.00, making them a valid downside target.
Short-Term Outlook
A close under 9009.00 will form a potentially bearish closing price reversal top. Not only is the index closing lower, but it’s also in a position to close below the opening and the mid-point of the session.
If confirmed on Monday by a break through Friday’s low, then look for the start of a minimum 2 to 3 day break. The first downside target zone is 8866.75 to 8822.25.
The short-term Fibonacci level at 8822.25 is a potential trigger point for an acceleration to the downside with potential targets the main bottom at 8678.00, followed by the main 50% level 8622.25.
This article was originally posted on FX Empire
More From FXEMPIRE:
Gold Price Prediction – Prices Rise and Finish a Volatile Week in the Black
USD/JPY Weekly Price Forecast – US Dollar Testing Major Resistance On Weekly Charts
The Weekly Wrap – Brexit, Iran, and Economic Data Drove the Majors in the Week
Natural Gas Price Prediction – Prices Rally as Cold Weather Emerges
