
 Yahoo Finance
 E-mini NASDAQ-100 Index (NQ) Futures Technical Analysis – Key Short-Term Support Moves Up to 13773.25
June E-mini NASDAQ-100 Index futures hit a record high late in the session on Thursday after shrugging off the previous session’s potentially bearish closing price reversal bottom. The rally was fueled by easing inflation fears, upbeat earnings reports and solid U.S. economic data.
At 20:53 GMT, June E-mini NASDAQ-100 Index futures are trading 13994.5, up 195.75 or +1.42%.
Assurances from the Federal Reserve to maintain an accommodative monetary policy despite higher inflation, more fiscal stimulus and a jump in retail sales as well as jobless claims that fell more than expected, helped lift the technology sector with Facebook, Amazon, Apple, Netflix and Alphabet all climbing more than 1%.
Daily Swing Chart Technical Analysis
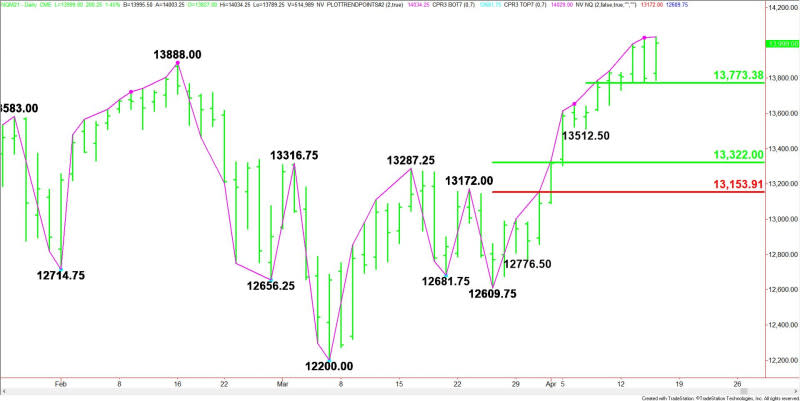
The main trend is up according to the daily swing chart. The uptrend was reaffirmed late in the session when buyers took out yesterday’s high and potentially bearish closing price reversal top at 14029.00. This negated the chart pattern.
The main trend will change to down on a trade through 12609.75. This is highly unlikely, however, the index is up 14 days from the last main bottom which puts it inside the window of time for a potentially bearish closing price reversal top.
This chart pattern may not signal a change in trend, but it will be a sign that the selling is greater than the buying at current price levels.
The minor trend is also up. A trade through 13512.50 will change the minor trend to down. This will also shift momentum to the downside.
The minor range is 13512.50 to 14034.25. Its 50% level at 13773.25 is potential support.
The short-term range is 12609.75 to 14034.25. If the minor trend changes to down then look for the selling to possibly extend into 13322.00 to 13154.00.
Short-Term Outlook
The uptrend is strong and there is no resistance so it doesn’t make sense to keep selling rallies. When you do, you’re only feeding the bull.
As far as a top is concerned, a closing price reversal or a break under the pivot at 13773.25 will be early signs of selling pressure, but not necessarily a change in trend.
For a look at all of today’s economic events, check out our economic calendar.
This article was originally posted on FX Empire
