
 Yahoo Finance
 E-mini NASDAQ-100 Index (NQ) Futures Technical Analysis – Main Trend Changes to Up on Trade Through 7789.50
September E-mini NASDAQ-100 Index futures finished higher on Friday, but this was not enough to offset the loss for the week. The technology-driven index was supported by a rebound in bond yields as fears of a recession eased.
Individual stocks also played a role in the market’s recovery. Chip maker Nvidia’s stock jumped more than 7% on Friday after it reported better-than-expected fiscal-second quarter earnings. Apple shares gained as investors bought back stocks beaten down by trade war fears.
On Friday, September E-mini NASDAQ-100 Index futures settled at 7611.75, up 115.50 or +1.52%.
Daily Swing Chart Technical Analysis
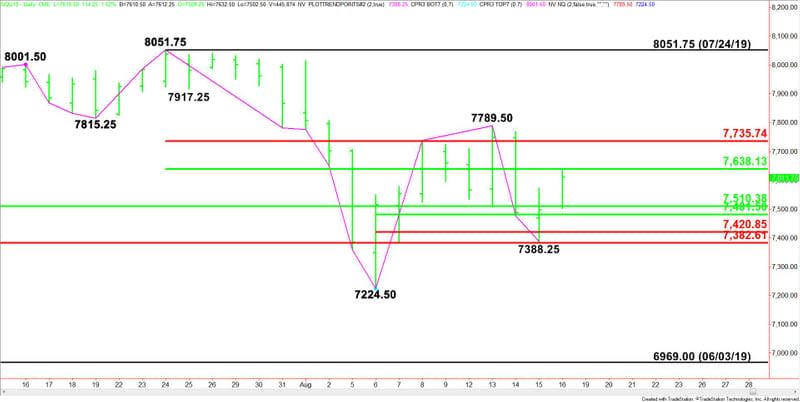
The main trend is down according to the daily swing chart. However, momentum has been trending slightly higher since the formation of the closing price reversal bottom at 7224.50 on August 6.
A trade through 7224.50 will signal a resumption of the downtrend. The main trend will change to up on a move through 7789.50.
The minor trend is also down. However, a new minor bottom has formed at 7388.25. After Friday’s gain, a trade through this minor bottom will shift momentum back to the downside.
The main range is 6969.00 to 8051.75. Its retracement zone at 7510.25 to 7382.50 is controlling the near-term direction of the index. The close above this support area is helping to generate an upside bias.
The intermediate range is 8051.75 to 7224.50. Its retracement zone at 7638.25 to 7735.75 provided some resistance last week. Buyers need to overcome this area in order to increase the upside momentum.
The short-term range is 7224.50 to 7789.50. Its retracement zone at 7481.50 to 7420.75 provided support last week. It falls inside the main retracement zone at 7510.25 to 7382.50.
Daily Swing Chart Technical Forecast
Based on Friday’s price action and the close at 7611.75, the direction of the September E-mini NASDAQ-100 Index on Monday is likely to be determined by trader reaction to the intermediate 50% level at 7638.25.
Bullish Scenario
A sustained move over 7638.25 will indicate the buying is getting stronger. If this creates enough upside momentum then look for a rally into the intermediate Fibonacci level at 7735.75. Overcoming this level will put the index in a position to challenge the main top at 7789.50. Taking out this level will change the main trend to up.
Bearish Scenario
A sustained move under 7638.00 will signal the presence of sellers. This could trigger an acceleration to the downside with the first layer of support coming in at 7510.25 to 7481.50. The second layer of support is 7420.75 to 7382.50.
A failure to hold 7382.50 could trigger a steep break into the main bottom at 7224.50.
This article was originally posted on FX Empire
More From FXEMPIRE:
Crude Oil Price Update – Rangebound – Strengthens Over $55.72, Weakens Under $53.95
Bitcoin Cash – ABC, Litecoin and Ripple Daily Analysis – 17/08/19
Brent Crude Oil Price Update – Short-Term Direction Controlled by Minor Pivot at $57.97
Forex Daily Recap – Rupee Pair Slipped -0.48% over Economic Stimulus Hopes
EUR/USD Forex Technical Analysis – Close Over 1.1110 Forms Closing Price Reversal Bottom
