
 Yahoo Finance
 E-mini NASDAQ-100 Index (NQ) Futures Technical Analysis – Fib Level at 7022.25 is Trigger Point for Potential Surge into Close
March E-mini NASDAQ-100 Index futures are trading sharply higher on Tuesday shortly before the close. The rally is being fueled by optimism over the start of high level trade talks between U.S. and Chinese officials. Negotiators are hoping to get enough on paper to avert the implementation of increased tariffs by the U.S. after March 1. Investors are also optimistic over the deal between Democrats and Republicans to prevent another government shutdown starting Saturday.
At 19:29 GMT, March E-mini NASDAQ-100 Index futures are trading 7022.00, up 107.75 or +1.55%.
Daily Swing Chart Technical Analysis
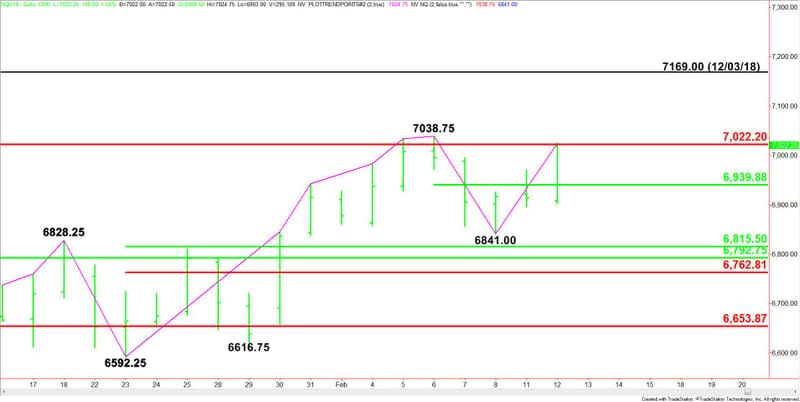
The main trend is up according to the daily swing chart. A trade through 7038.75 will signal a resumption of the uptrend. The main trend will change to down on a trade through 6841.00.
The short-term range is 7038.75 to 6841.00. Its 50% level or pivot at 6938.75 is new support.
The long-term retracement zone is 6792.75 to 7022.25. The index is currently testing the upper level of this zone at 7022.25. Crossing to the strong side of this zone will put the index in a bullish position.
Daily Swing Chart Technical Forecast
Based on the price action late in the session, the direction of the March E-mini NASDAQ-100 Index futures contract into the close is likely to be determined by trader reaction to the major Fibonacci level at 7022.25.
Bullish Scenario
Taking out 7022.25 and sustaining the move will indicate the buying is getting stronger. The next target is the main top at 7038.75. This level is the trigger point for a potential acceleration to the upside with the next major target the December 3 main top at 7169.00.
Bearish Scenario
The inability to overcome 7022.25 with conviction or a sustained move under this level will signal the presence of sellers. If this creates some late session momentum then look for a potential break into the short-term 50% level at 6938.75.
This article was originally posted on FX Empire
