
 Yahoo Finance
 E-mini NASDAQ-100 Index (NQ) Futures Technical Analysis – Downside Targets are 6815.50 and 6792.75
March E-mini NASDAQ-100 Index futures are trading lower at the mid-session. The selling pressure is being driven by renewed concerns over U.S.-China trade negotiations and the slowing global economy. Investors are dumping risky assets because of uncertainty over the timing of a U.S.-China trade deal. Additionally, central banks have been lowering their outlooks for their respective economies, encouraging investors to book profits and move money into safe-haven assets.
At 1640 GMT, March E-mini NASDAQ-100 Index futures are trading 6857.00, down 50.50 or -0.71%.
Daily Swing Chart Technical Analysis
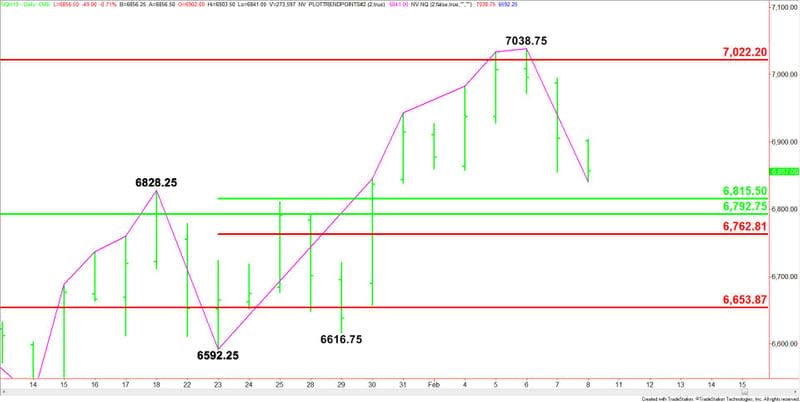
The main trend is up according to the daily swing chart, however, momentum has been trending lower since the formation of the closing price reversal top on February 6.
A trade through 7038.75 will negate the reversal top and signal a resumption of the uptrend. The main trend will change to down on a trade through 6592.25.
The major retracement zone is 6792.75 to 7022.25. This zone is controlling the longer-term direction of the index. Currently, the index is trading inside this zone, neutralizing the rally.
The main range is 6592.25 to 7038.75. Its retracement zone is 6815.50 to 6762.75. Trading inside this zone is the major 50% level at 6792.75.
Daily Swing Chart Technical Forecast
Bearish Scenario
If the downside momentum continues then look for sellers to drive the index into the minor 50% level at 6815.50. If this fails then look for the selling to extend into the major 50% level at 6792.75, followed by the major Fibonacci level at 6762.75. Since the main trend is up, buyers are likely to step in on a test of any of these levels.
Bullish Scenario
The new short-term range is 7038.75 to 6841.00. If this range remains intact then look for a potential retracement into 6940.00.
Weekly Closing Price Reversal Top
A close under 6877.75 will form a potentially bearish closing price reversal top on the weekly chart. If confirmed next week, this could trigger the start of a 2 to 3 week counter-trend break.
This article was originally posted on FX Empire
More From FXEMPIRE:
GBP/USD Weekly Price Forecast – British pound finds support late in the week
Crude Oil Weekly Forecast – crude oil markets pull back for the week
GBP/JPY Weekly Price Forecast – British pound chops while finding support
Crude Oil Price Forecast – crude oil markets pulled back slightly on Friday
Natural Gas Price Forecast – natural gas markets sluggish on Friday
