
 Yahoo Finance
 E-mini NASDAQ-100 Index (NQ) Futures Technical Analysis – Strengthens Over 7638.25, Weakens Under 7602.75
September E-mini NASDAQ-100 Index futures are trading sharply lower on Tuesday shortly after the cash market opening. The early selling was fueled by worries about U.S.-China trade relations. The second wave of selling was triggered by weaker-than-expected ISM U.S. Manufacturing PMI data, which showed its lowest reading in more than three years.
At 14:53 GMT, September E-mini NASDAQ-100 Index futures are trading 7642.00, down 48.75 or -0.64%.
Chipmakers such as Nvidia and Skyworks Solutions fell 1.8% and 1.6%, respectively.
Daily Technical Analysis
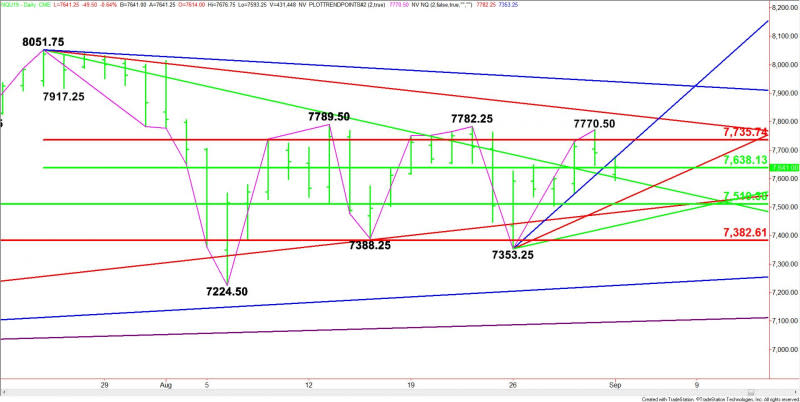
The main trend is down according to the daily swing chart. Last week’s rally into 7770.50 failed shortly before a pair of main tops at 7782.25 and 7789.50. This divergence from the Dow and S&P 500 Index may have been an early sign of weakness.
The main trend will change to up on a trade through 7782.25. A move through 7353.25 will signal a resumption of the downtrend.
The minor trend is up. A new main top was formed at 7770.50. A trade through 7504.25 will change the minor trend to down. This will also shift momentum to the downside.
The short-term range is 8051.75 to 7224.50. Its retracement zone at 7638.25 to 7735.75 is resistance. Crossing to the strong side of this zone will put the index in a bullish position.
The main range is 6969.00 to 8051.75. Its retracement zone at 7510.25 to 7382.50 is support. This zone is controlling the near-term direction of the index.
Daily Technical Forecast
Based on the early price action, the direction of the September E-mini NASDAQ-100 Index the rest of the session on Tuesday is likely to be determined by trader reaction to the short-term 50% level at 7638.25 and the downtrending Gann angle at 7602.75. Trading between these levels will turn the index neutral.
Bullish Scenario
A sustained move over 7638.25 will indicate the presence of buyers. The first target is a steep uptrending Gann angle at 7673.25. Overcoming this angle will indicate the buying is getting stronger with the next target the short-term Fibonacci level at 7735.75. This is followed by the minor top at 7770.50 and the main tops at 7782.25 and 7789.50.
Bearish Scenario
A sustained move under 7602.75 will signal the presence of sellers. This could trigger an acceleration to the downside with the next target a support cluster at 7513.25 to 7510.25.
This article was originally posted on FX Empire
