
 Yahoo Finance
 E-mini NASDAQ-100 Index (NQ) Futures Technical Analysis – March 9, 2018 Forecast
June E-mini NASDAQ-100 Index futures are trading sharply higher after the cash market opening. The rally is being fueled by a solid U.S. jobs report and the news that the U.S. and North Korea will meet before May to discuss nuclear-related issues. Concerns over a trade war seem to have been cast aside.
Daily Swing Chart Technical Analysis
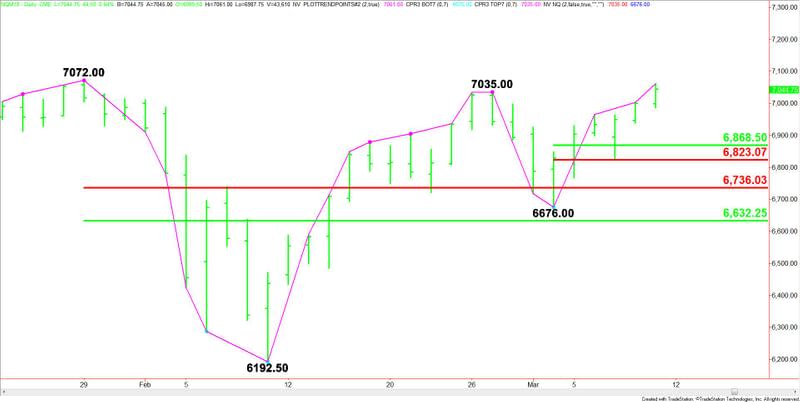
The main trend is up according to the daily swing chart. The trend changed up on the trade through 7035.00 after momentum had been trending higher for several days. If the upside momentum continues then we’re likely to see the rally continue into the all-time high at 7072.00.
The main trend will change to down on a move through 6676.00.
The new short-term range is 6676.00 to 7061.00. If there is an intraday setback then its retracement zone at 6868.50 to 6823.50 will become its primary downside target.
The main range is 7072.00 to 6192.50. Its retracement zone at 6736.00 to 6632.25 is the major support.
Daily Swing Chart Technical Forecast
Based on the early trade, the index is likely to trend higher throughout the session as long as it can hold above the former swing top at 7035.00.
Bullish traders are going to try to drive the index through 7035.00 and sustain the move. Breaking back below this level will indicate the buying is weak, or perhaps sellers have re-emerged. The biggest fear for bullish traders at this time is the potentially bearish closing price reversal top.
This article was originally posted on FX Empire
