
 Yahoo Finance
 E-mini NASDAQ-100 Index (NQ) Futures Technical Analysis – Setting-Up for Closing Price Reversal Top
June E-mini NASDAQ-100 Index futures are trading lower shortly after the cash market opening on Thursday, as millions more applied for jobless claims in the United States, overshadowing upbeat results from Facebook and Tesla. Stocks were also under pressure after the European Central Bank said it was prepared to increase its emergency asset purchase program. Some traders were hoping the ECB would announce an increase Thursday.
At 14:08 GMT, June E-mini NASDAQ-100 Index futures are trading 9004.00, down 114.25 or -1.47%.
Despite the selling pressure in the broad-based market, Facebook and Microsoft jumped 6% and 0.6% respectively after reporting promising revenue figures.
Daily Swing Chart Technical Analysis
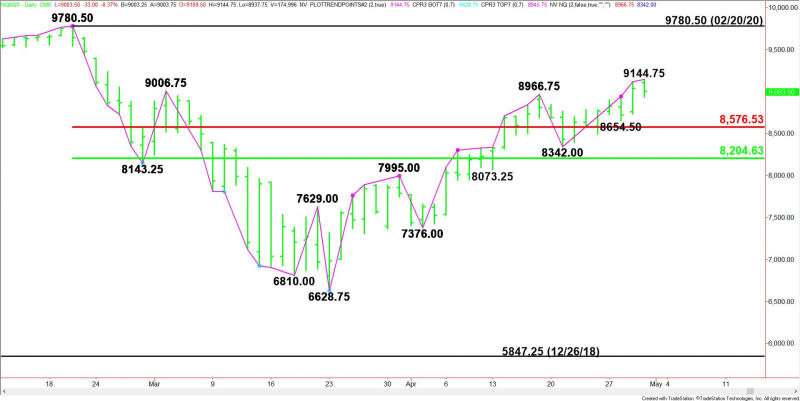
The main trend is up according to the daily swing chart, however, momentum may be shifting lower with the formation of an intraday closing price reversal top.
A trade through 9144.75 will signal a resumption of the uptrend. The main trend will change to down on a trade through 8342.00.
The minor trend is also up. A trade through 8654.50 will change the minor trend to down. This will also shift momentum to the downside.
The main range is 9780.50 to 6628.75. Its retracement zone at 8576.50 to 8204.50 is support. It is also controlling the longer-term direction of the index.
Daily Swing Chart Technical Forecast
Based on the early price action and the current price at 9004.00, the direction of the June E-mini NASDAQ-100 Index the rest of the session on Thursday is likely to be determined by trader reaction to yesterday’s close at 9036.50.
Bearish Scenario
A sustained move under 9036.50 will indicate the presence of sellers. If this creates enough downside momentum then look for a quick break into a minor 50% level at 8899.50. If this level fails as support then look for the selling to possibly extend into 8654.50 to 8576.50.
Bullish Scenario
A sustained move over 9036.50 will signal the presence of buyers. This could lead to a retest of 9144.75. Overtaking this level could trigger another acceleration to the upside.
Side Notes
A close under 9036.50 will form a potentially bearish closing price reversal top. If confirmed, this could lead to the start of a 2 to 3 day correction. This chart pattern may signal selling pressure, but will not change the trend to down.
This article was originally posted on FX Empire
