
 Yahoo Finance
 E-mini NASDAQ-100 Index (NQ) Futures Technical Analysis – Direction Determined by Reaction to 8715.50
March E-mini NASDAQ-100 Index futures are trading lower shortly after the cash market opening. Volume is expected to remain light ahead of Wednesday’s holiday break. The early price action suggests investors are still the profit-taking and position-squaring mode after touching a record high on Friday.
We’re not looking for a change in trend over the near-term, but we’re not going to be surprised by a short-term correction into a value area. With Phase 1 of the trade deal between the United States and China nearly signed, traders are going to start paying attention to valuation rather than just optimism over the end of the trade war.
At 14:32 GMT, March E-mini NASDAQ-100 Index futures are trading 8723.00, down 10.75 or -0.12%.
Daily Technical Analysis
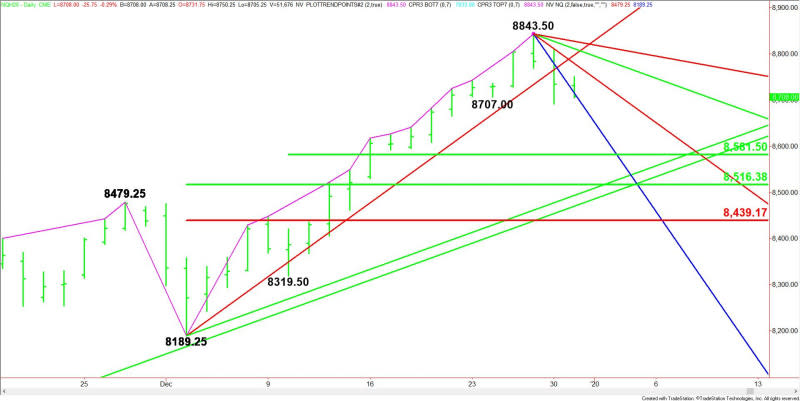
The main trend is up according to the daily swing chart, but momentum is trending lower. Momentum shifted to the downside when the index posted a closing price reversal top on Friday and confirmed the chart pattern on Monday.
A trade through 8843.50 will negate the closing price reversal top and signal a resumption of the uptrend. This chart pattern won’t change the trend to down, but it could trigger the start of a 2 to 3 day break or a 50% correction of the last rally. The main trend will change to down on a trade through 8189.25.
The minor trend is down. It turned down on Monday when sellers took out 8707.00. This move confirmed the shift in momentum to down.
The minor range is 8319.50 to 8843.50. Its 50% level at 8581.50 is the first downside target.
The main range is 8189.25 to 8843.50. Its retracement zone at 8516.25 to 8439.00 is the best value zone target. Since the main trend is up, buyers are likely to come in on a test of this zone.
Daily Technical Forecast
Based on the early price action and the current price at 8723.00, the direction of the March E-mini NASDAQ-100 Index the rest of the session is likely to be determined by trader reaction to the steep downtrending Gann angle at 8715.50.
Bearish Scenario
A sustained move under 8715.50 will indicate the presence of sellers. This could trigger an acceleration to the downside with the next target a 50% level at 8581.50.
Bullish Scenario
A sustained move over 8715.50 could lead to labored rally due to a number of potential resistance angles at 8779.50, 8797.25 and 8811.50.
This article was originally posted on FX Empire
