
 Yahoo Finance
 E-mini NASDAQ-100 Index (NQ) Futures Technical Analysis – November 19, 2018 Forecast
December E-mini NASDAQ-100 Index futures are expected to open lower based on the pre-market trade. Earlier in the session, buyers attempted to follow-through to the upside, but the rally stalled when shares of Apple began to weaken. The stock is down about 1 percent before the opening. This helped turn the entire tech sector lower.
Daily Swing Chart Technical Analysis
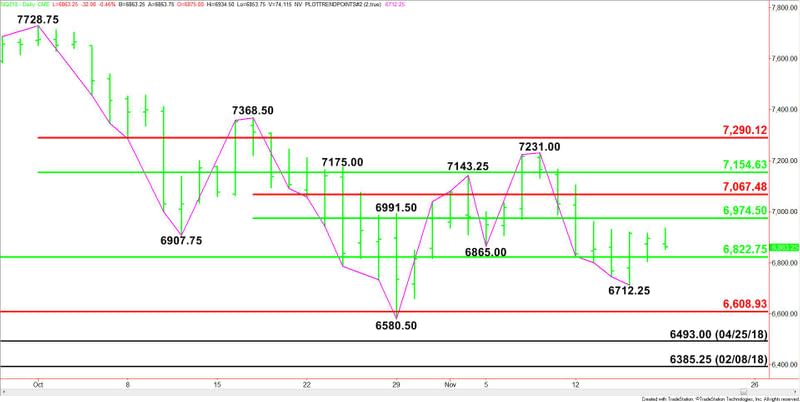
The main trend is down according to the daily swing chart. The main trend will change to up when buyers take out 7231.00. A move through 6712.25 will negate Thursday’s closing price reversal bottom. This will signal a resumption of the downtrend.
The closing price reversal bottom was confirmed earlier today, but without much follow-through. If buyers can take out 6934.50 later in the session then we could see the start of a 2 to 3 day counter-trend rally.
The major support is the retracement zone at 6822.75 to 6609.00. This zone stopped the selling at 6580.50 on October 29 and last week at 6712.25.
The short-term range is 7368.50 to 6580.50. Its retracement zone at 6974.50 to 7067.50 is resistance.
The main range is 7728.75 to 6580.50. Its retracement zone at 7154.75 to 7290.25 is the next resistance zone. This area stopped a rally at 7231.00 on November 8.
Daily Swing Chart Technical Forecast
Based on the early price action, the direction of the December E-mini NASDAQ-100 Index is likely to be determined by trader reaction to a pair of 50% levels at 6822.75 and 6974.50.
Holding between 6822.75 and 6974.50 will indicate investor indecision and impending volatility.
Bullish Scenario
Taking out 6974.50 will indicate the presence of buyers. If this attracts enough buying volume then look for potential rallies into 7067.50 and 7154.75.
Bearish Scenario
A sustained move under 6822.75 will signal the presence of sellers. This could lead to a retest of last week’s low at 6712.25. If this price level fails then look for the selling to extend into 6609.00 then 6580.50.
This article was originally posted on FX Empire
More From FXEMPIRE:
Crude Oil Price Forecast – crude oil markets get hammered again
S&P 500 Price Forecast – stock markets struggle to kick off week
Gold Price Futures (GC) Technical Analysis – November 19, 2018 Forecast
E-mini Dow Jones Industrial Average (YM) Futures Analysis – November 19, 2018 Forecast
Natural Gas Price Forecast – natural gas markets gapped higher to start week
