
 Yahoo Finance
 E-mini NASDAQ-100 Index (NQ) Futures Technical Analysis – December 08, 2017 Forecast
March E-mini NASDAQ-100 Index futures are called higher based on the early trade. Investors are having a positive reaction to the better-than-expected November Non-Farm Payrolls number.
Daily Technical Analysis
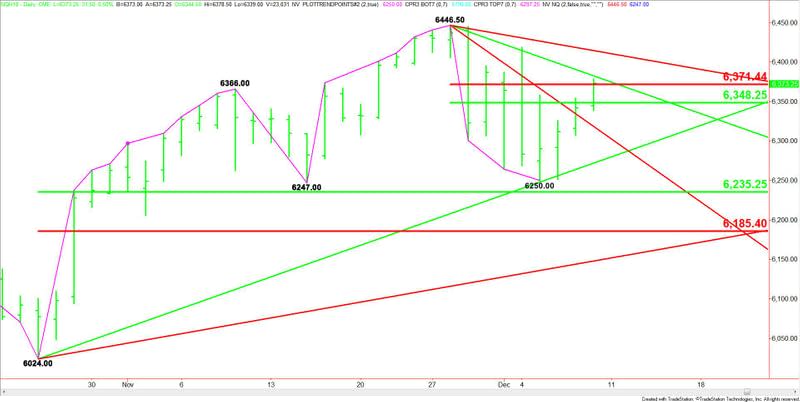
The main trend is up according to the daily swing chart. A trade through 6446.50 will signal a resumption of the uptrend. The main trend will change to down on a move through 6250.00.
The short-term range is 6446.50 to 6250.00. The index is currently testing its retracement zone at 6348.25 to 6371.50. Overcoming this area will be bullish and turn the zone into support.
The main range is 6024.00 to 6446.50. If the trend changes to down then look for a test of its retracement zone at 6235.25 to 6185.50.
Daily Technical Forecast
The direction of the index today is likely to be determined by trader reaction to the Fibonacci level at 6371.50.
A sustained move over 6371.50 will indicate the presence of buyers. Overtaking the downtrending angle at 6382.50 will signal that the buying is getting stronger. This could lead to a test of the next downtrending angle at 6414.50. This is the last potential resistance angle before the 6446.50 main top.
The inability to overcome 6371.50 will signal the presence of sellers. The next target is the 50% level at 6348.25. The daily chart starts to open up to the downside under this level with the next target coming in at 6318.50.
Crossing to the weak side of 6318.50 could trigger a break into the long-term uptrending Gann angle at 6272.00. If this angle fails then look for a test of 6250.00, followed by 6247.00 and 6235.25.
This article was originally posted on FX Empire
