
 Yahoo Finance
 E-mini NASDAQ-100 Index (NQ) Futures Technical Analysis – March 15, 2018 Forecast
June E-mini NASDAQ-100 Index futures are trading lower shortly after the cash market opening. Professionals are selling the tech-based index because they feel it is overbought. At the same time, the S&P 500 and Dow are picking up bids because they may be undervalued.
Despite the mixed price action, all three major indexes are being pressured by concerns over a possible trade war.
Daily Technical Analysis
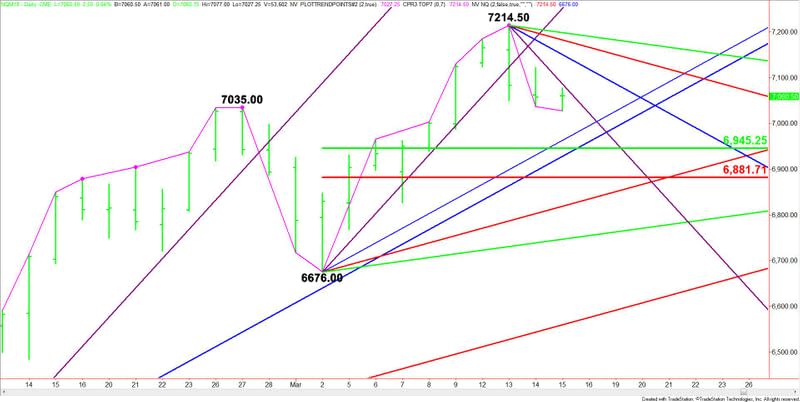
The main trend is up according to the daily swing chart. A trade through 7214.50 will signal a resumption of the uptrend. The trend isn’t close to turning down, but Tuesday’s closing price reversal top has shifted momentum to the downside.
The main range is 6676.00 to 7214.50. Its retracement zone at 6945.25 to 6881.75 is the primary downside target. Since the trend is up, buyers may come in on a test of this zone.
Daily Technical Forecast
Based on the early trade, the direction of the index is likely to be determined by trader reaction to the steep downtrending Gann angle at 7086.50.
A sustained move under 7086.50 will signal the presence of sellers. If this move generates enough downside momentum then look for the selling to extend into a short-term uptrending Gann angle at 6964.00. Once again, buyers could come in on a test of this Gann angle.
If 6964.00 fails as support then look for the selling to extend into a 50% level at 6945.25 and a long-term uptrending Gann angle at 6928.25.
If 6928.25 fails as support, the index could plunge into the Fibonacci level at 6881.75.
A sustained move over 7086.50 will indicate the presence of buyers. This is a possible trigger point for a rally into the next downtrending angle at 7150.50. This is followed by a Gann angle at 7150.50.
A failure to overtake the downtrending Gann angles could mean the index is getting ready to roll over to the downside.
This article was originally posted on FX Empire
More From FXEMPIRE:
E-mini NASDAQ-100 Index (NQ) Futures Technical Analysis – March 15, 2018 Forecast
Daily Grains Analysis for March 15, 2018 – Corn Breaks Higher
Fair Gaming is the Future: TruePlay Sets a New Transparency Standard for the Gambling Industry
USD/CAD Bullish SHS Pattern for a bounce towards 1.3000 and above