E-mini NASDAQ-100 Index (NQ) Futures Technical Analysis – July 11, 2018 Forecast
September E-mini NASDAQ-100 Index futures are called lower shortly before the cash market opening. The early selling pressure is a knee-jerk reaction to the threat of new tariffs on China by the Trump Administration and a possible retaliation from China.

Daily Technical Analysis
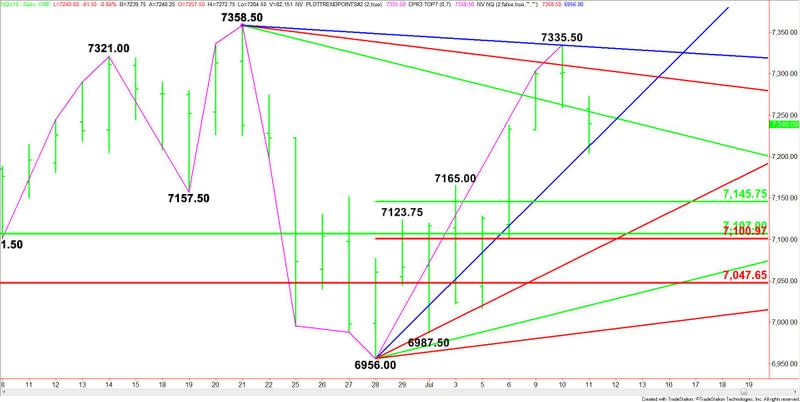
The main trend is down according to the daily swing chart, however, momentum is trending higher. A trade through 7335.50 will change the main trend to up.
The main range is 6956.00 to 7335.50. Its retracement zone at 7145.75 to 7101.00 is the primary downside target. The long-term retracement zone at 7107.00 to 7047.50 is another downside target.
Combining the two retracement zone creates a support cluster at 7107.00 to 7101.00. This is the best downside target at this time.
Daily Technical Forecast
Based on the early price action, the direction of the September E-mini NASDAQ-100 Index today is likely to be determined by trader reaction to the steep uptrending Gann angle at 7212.00. This angle held earlier as support.
A sustained move over 7212.00 will indicate the presence of buyers. This could lead to a test of the downtrending Gann angle at 7254.50. Overtaking 7254.50 will indicate the buying is getting stronger. This could trigger a surge into downtrending Gann angles at 7306.50 and 7332.00. The latter is the last potential resistance angle before the 7335.50 main top.
A sustained move under 7212.00 will signal the presence of sellers. This is a potential trigger point for an acceleration to the downside with the first target a 50% level at 7145.75, followed by a support cluster at 7107.00 to 7101.00.
Basically, we’re looking for an upside bias to develop on a sustained move over 7254.50 and for a downside bias to develop on a sustained move under 7212.00. Holding between these two numbers will indicate investor indecision.
This article was originally posted on FX Empire
More From FXEMPIRE:
Gold Price Futures (GC) Technical Analysis – July 11, 2018 Forecast
Natural Gas Price Fundamental Daily Forecast – Production Surge Continues to Weigh on Prices
The US is Probably Targeting key Chinese Manufacturing Export Industries, Trade War Escalates
E-mini NASDAQ-100 Index (NQ) Futures Technical Analysis – July 11, 2018 Forecast

 Yahoo Finance