
 Yahoo Finance
 E-mini NASDAQ-100 Index (NQ) Futures Technical Analysis – Strengthens Over 12418.50, Weakens Under 12068.50
March E-mini NASDAQ-100 Index futures are trading lower shortly before the release of the February U.S. Non-Farm Payrolls report and the cash market opening.
The government will release its February Non-Farm Payrolls report at 13:30 GMT. The headline number is expected to show the economy added 210,000 new jobs, compared to just 49,000 in January, according to Dow Jones. Average Hourly Earnings are expected to increase 0.2% and the Unemployment Rate is expected to hold steady at 6.3%.
At 10:27 GMT, March E-mini NASDAQ-100 Index futures are trading 12401.50, down 53.50 or -0.43%.
On Thursday, the technology index finished sharply lower, leaving the NASDAQ Composite down around 10% from its February high, after markets from Federal Reserve Chair Jerome Powell disappointed investors worried about rising longer-term U.S. bond yields.
Trading Tip: Don’t trade off of the headline jobs number. Use the June 10-year Treasury note for guidance. There are just too many Non-Farm guesses out there. You won’t be able to tell if it’s bullish or bearish. You also may want the T-notes to settle before making your move. Sometimes there is a reaction to the headline number and a different reaction to the unemployment rate. This causes whipsaw price action. Don’t force a trade either. Sometimes there is little reaction to this report.
If T-notes are moving lower, rates are rising. This tends to be bearish for stocks. If T-notes are moving higher, rates are falling. This tends to be bullish for stocks.
Daily Swing Chart Technical Analysis
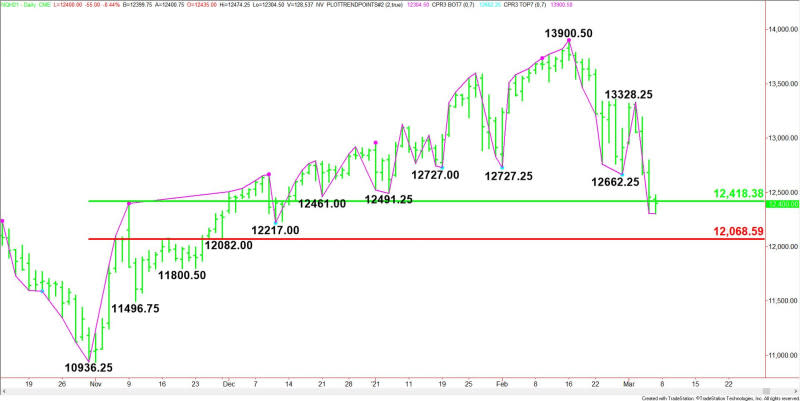
The main trend is down according to the daily swing chart. A trade through 12217.00 will reaffirm the downtrend. The main trend will change to up on a move through 13328.25. This is not likely, but there is room for a minor reversal to the upside.
The main range is 10936.25 to 13900.50. The index is currently testing its retracement zone at 12418.50 to 12068.50. Trader reaction to this zone will determine the longer-term direction of the index.
Daily Swing Chart Technical Forecast
The direction of the March E-mini NASDAQ-100 Index futures contract on Friday is likely to be determined by trader reaction to the main 50% level at 12418.50.
Bullish Scenario
A sustained move over 12418.50 will indicate the presence of buyers. Turning higher for the session will indicate the shorts are covering or counter-trend traders are buying. This could trigger a rally into perhaps 12816.50. This is a minor 50% level so it will move down as the market moves lower.
Bearish Scenario
A sustained move under 12418.25 will signal the presence of sellers. If this creates enough downside momentum then look for the selling to possibly extend into the main Fibonacci level at 12068.50. We could see a technical bounce on the first test of this level, but taking it out could trigger an acceleration to the downside.
For a look at all of today’s economic events, check out our economic calendar.
This article was originally posted on FX Empire
More From FXEMPIRE:
GBP/USD Price Forecast – Pound Bounces From Major Support Level
Gold Price Futures (GC) Technical Analysis – Trend Down, but Could Begin to Strengthen Over $1711.70
EUR/USD Daily Forecast – Euro Continues To Lose Ground Against U.S. Dollar
USD/JPY Price Forecast – US Dollar Continues to Crush Japanese Yen
AUD/USD Weekly Price Forecast – Aussie Dollar Continues to Struggle
