
 Yahoo Finance
 E-mini NASDAQ-100 Index (NQ) Futures Technical Analysis – Trading on Bullish Side of 7883.25 Pivot
December E-mini NASDAQ-100 Index futures are trading higher during the premarket session. Traders are saying the index is being boosted by optimism over the resumption of face-to-face trade talks between the United States and China for the first time in almost two months. This week’s interest rate cut by the Federal Reserve and last week’s trimming by the European Central Bank (ECB) are also helping to improve market sentiment.
At 10:36 GMT, December E-mini NASDAQ-100 Index futures are trading 7944.00, up 26.00 or +0.33%.
Daily Swing Chart Technical Analysis
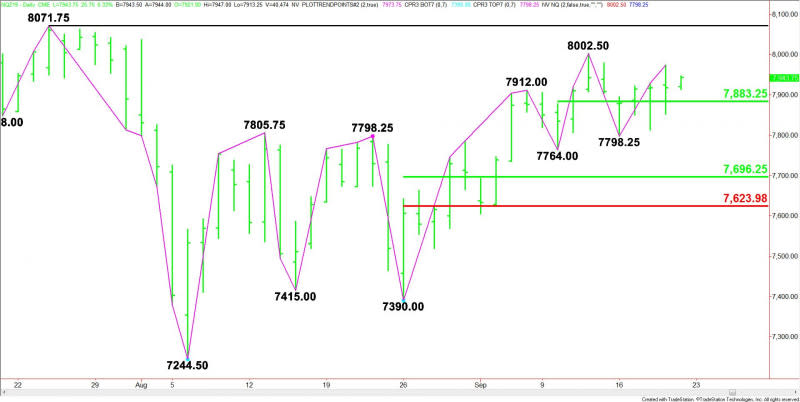
The main trend is up according to the daily swing chart. A trade through 8002.50 will signal a resumption of the uptrend. The main trend will change to down on a trade through 7798.25.
The short-term range is 7764.00 to 8002.50. Its 50% level at 7883.25 is support. It’s also controlling the direction of the market today.
The main range is 7390.00 to 8002.50. If the main trend changes to down then its retracement zone at 7696.25 to 7624.00 will become the primary downside target.
Daily Swing Chart Technical Forecast
Based on the price action this week and the current price at 7944.00, the direction of the December E-mini NASDAQ-100 Index the rest of the session on Friday is likely to be determined by trader reaction to the 50% level at 7883.25.
Bullish Scenario
A sustained move over 7883.25 will indicate the presence of buyers. If this creates enough upside momentum then look for buyers to make a run at yesterday’s high at 7973.75, followed by the main top at 8002.50. This is a potential trigger point for an acceleration into the all-time high at 8071.75.
Bearish Scenario
A sustained move under 7883.25 will signal the presence of sellers. The first downside target is the minor bottom at 7813.50, followed by the main bottom at 7798.25.
The trend changes to down if 7798.25 is taken out. This could trigger a break into the next main bottom at 7764.00. This is a potential trigger point for an acceleration into the main retracement zone at 7696.25 to 7624.00.
This article was originally posted on FX Empire
More From FXEMPIRE:
U.S. Dollar Index Futures (DX) Technical Analysis – Weakens Under 97.700, Strengthens Over 97.930
EUR/USD Daily Forecast – Euro Continues to Range Below Resistance
Oil Price Fundamental Daily Forecast – Markets Likely to Remain Bid Due to Middle East Tensions
GBP/USD Daily Forecast – Sterling Breaks Higher on Brexit Deal Optimism
