
 Yahoo Finance
 E-mini NASDAQ-100 Index (NQ) Futures Technical Analysis – Must Hold 8265.50 to Sustain Upside Momentum
December E-mini NASDAQ-100 Index futures hit a record high early Friday on the back of positive comments from a White House official on the status of the on-going trade negotiations between the United States and China.
White House economic adviser Larry Kudlow claimed on Thursday that phase one of a trade deal between the world’s two largest economies was “getting close,” according to Reuters, while Chinese Ministry of Commerce spokesman Gao Feng continued Beijing’s call for a removal of existing tariffs.
At 09:35 GMT, December E-mini NASDAQ-100 Index futures are trading 8296.25, up 30.75 or +0.37%.
Daily Swing Chart Technical Analysis
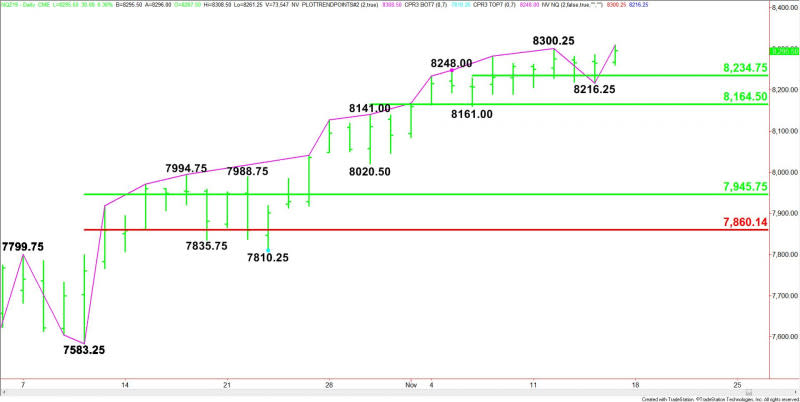
The main trend is up according to the daily swing chart. The uptrend was reaffirmed when buyers took out the previous main top at 8300.25. A trade through 8216.25 will change the main trend to down.
Due to the prolonged up move in terms of price and time, the index is also susceptible to a potentially bearish closing price reversal top. This won’t change the main trend to down, but it could lead to a 2 to 3 day counter-trend trade.
The first minor rolling range is 8161.00 to 8308.50. Its 50% level or pivot at 8234.75 is potential support.
The second minor rolling range is 8020.50 to 8308.50. Its 50% level at 8164.50 is another potential support level.
Daily Swing Chart Technical Forecast
Based on the early price action, the direction of the December E-mini NASDAQ-100 Index the rest of the session on Friday is likely to be determined by trader reaction to Thursday’s close at 8265.50.
Bullish Scenario
A sustained move over 8265.50 will indicate the presence of buyers. Taking out the intraday high at 8308.50 will indicate the buying is getting stronger. This could trigger an acceleration to the upside especially if the move is news driven.
Bearish Scenario
A sustained move under 8265.50 will signal the presence of sellers. If this creates enough downside momentum then look for a pullback into the first minor pivot at 8234.75, followed closely by the main bottom at 8216.25. Taking out this bottom will change the main trend to down. This could trigger a further break into the next 50% level at 8164.50, followed by the next minor low at 8161.00.
The daily chart indicates there is plenty of room to the downside under 8161.00 with the next major downside target coming in at 8020.50.
This article was originally posted on FX Empire
More From FXEMPIRE:
Gold Price Futures (GC) Technical Analysis – Could Strengthen Over $1471.00, Weaken Under $1460.90
USD/JPY Fundamental Daily Forecast – It’s ‘Risk-On’ with Some Limitations
GBP/USD, EUR/GBP, USD/CAD – Little Movement Ahead of U.S. Retail Sales
Bitcoin Cash – ABC, Litecoin and Ripple Daily Analysis – 15/11/19
