
 Yahoo Finance
 E-mini NASDAQ-100 Index (NQ) Futures Technical Analysis – February 19, 2019 Forecast
March E-mini NASDAQ-100 Index futures are edging lower on Tuesday as traders return from the U.S. President’s Day holiday. Investors are primarily following the lead of the markets in Asia and Europe that traded slightly lower earlier in the day. Trader attention is focused largely on trade developments between the United States and China, with a new round of negotiations set to begin in Washington later today.
At 09:43 GMT, March E-mini NASDAQ-100 Index futures are trading 7058.00, down 22.75 or -0.32%.
Daily Technical Analysis
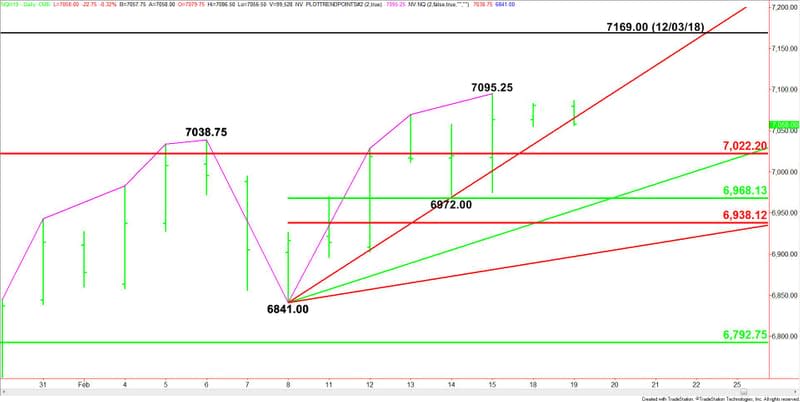
The main trend is up according to the daily swing chart. A trade through 7095.25 will signal a resumption of the uptrend. The main trend will change to down on a trade through 6841.00.
The minor trend is also up. Taking out 6972.00 will change the minor trend to down. This will also shift momentum to the downside.
Today’s session begins with the index on the bullish side of a major retracement zone at 7022.25 to 6792.75.
The short-term range is 6841.00 to 7095.25. Its retracement zone at 6968.00 to 6938.00 is the first downside target. Since the main trend is up, buyers could return on a test of this zone.
Daily Technical Forecast
Based on the early price action, the direction of the March E-mini NASDAQ-100 Index is likely to be determined by trader reaction to the uptrending Gann angle at 7033.00.
Bullish Scenario
A sustained move over 7033.00 will indicate the presence of buyers. If this creates enough upside momentum then look for a retest of 7095.25. Taking out this top will reaffirm the uptrend with the December 3 main top at 7169.00 the primary upside target.
Bearish Scenario
A sustained move under 7033.00 will signal the presence of sellers. The next downside target is the major Fibonacci level at 7022.25. The daily chart indicates there is plenty of room to the downside if this level fails with 6968.00 the next target.
This article was originally posted on FX Empire
More From FXEMPIRE:
Crude Oil Price Update – Trader Reaction to $56.62 Will Set Tone Today
E-mini NASDAQ-100 Index (NQ) Futures Technical Analysis – February 19, 2019 Forecast
GBP/USD Price Forecast – GBP/USD to Range Bound on Lack Of Bullish Influence
Introduction to Trading Indicators & Oscillators Part I – Webinar February 20
Asian Equities Give Up Gains After Reaching a Four-Month High
