
 Yahoo Finance
 E-mini NASDAQ-100 Index (NQ) Futures Technical Analysis – May Be Setting Up for 2-3 Day Correction
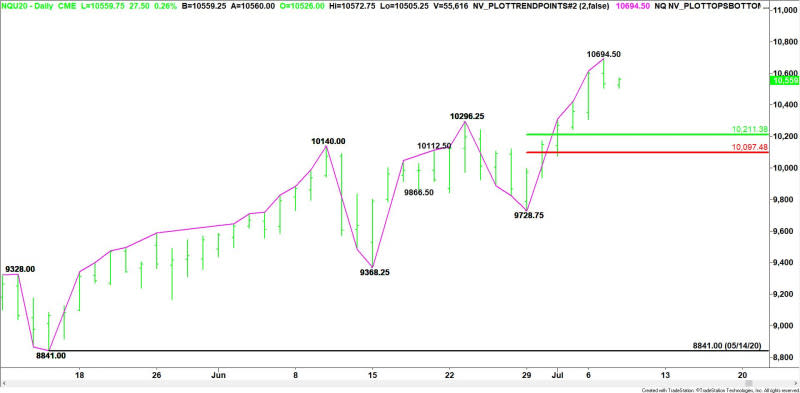
September E-mini NASDAQ-100 Index futures are trading slightly better on Wednesday after posting a potentially bearish closing price reversal top the previous session. The chart pattern doesn’t change the trend to down, but it could be signaling a shift in momentum to the downside. Basically, there are more sellers than buyers at current price levels and a short-term correction may be in order to alleviate some of the upside pressure.
At 07:25 GMT, September E-mini NASDAQ-100 Index futures are trading 10558.75, up 26.50 or +0.25%.
Technology stocks eased on Tuesday as investors took profits amid new U.S. coronavirus cases and a warning about the economy from Federal Reserve officials. The NASDAQ was outperforming the other two main indexes, hovering between gains and losses but claiming another record high. Boosting the E-mini NASDAQ-100 Index were shares of technology heavyweights Microsoft Corp and Apple Inc.
Daily Swing Chart Technical Analysis
The main trend is up according to the daily swing chart, however, momentum may be getting ready to shift to the downside, following yesterday’s closing price reversal top. This won’t change the main trend, but it could lead to a 2-3 day break or at least a 50% correction of the last rally.
A trade through 10694.50 will negate the closing price reversal top and signal a resumption of the uptrend. The main trend will change to down on a move through 9728.75.
A move through 10505.75 will confirm the closing price reversal top.
The short-term range is 9728.75 to 10694.50. If the closing price reversal top is formed and momentum starts to build to the downside then look for a break into its retracement zone at 10211.25 to 10097.50.
Daily Swing Chart Technical Forecast
Based on yesterday’s closing price reversal top, the direction of the September E-mini NASDAQ-100 Index futures contract on Wednesday is likely to be determined by trader reaction to yesterday’s low at 10505.75.
Bullish Scenario
A sustained move over 10505.75 will indicate the presence of buyers. If this is able to generate some upside momentum then look for a rally into a minor pivot at 10600.25. We could see some counter-trend selling on the first test of this level. Overcoming it, however, will indicate the buying is getting stronger with 10694.50 the next potential upside target.
Bearish Scenario
A sustained move under 10505.75 will signal the presence of sellers and confirm the closing price reversal top. If the move is able to generate enough downside momentum then look for the selling to possibly lead to a 2 to 3 day correction into the short-term retracement zone at 10211.25 to 10097.50.
For a look at all of today’s economic events, check out our economic calendar.
This article was originally posted on FX Empire
More From FXEMPIRE:
GBP/USD Daily Forecast – British Pound Continues Its Upside Move
Oil Price Fundamental Daily Forecast – All Eyes on EIA Gasoline Inventory Data
Price of Gold Fundamental Daily Forecast – Gloomy Fed Officials May Have Greenlit Next Rally
AUD/USD Forex Technical Analysis – Strengthens Over .6922, Weakens Under .6921
