
 Yahoo Finance
 E-mini NASDAQ-100 Index (NQ) Futures Technical Analysis – Has to Hold 9527.50 to Sustain Rally
March E-mini NASDAQ-100 Index futures hit a record high overnight as investors continue to downplay the impact of the coronavirus outbreak on the U.S. economy. Traders are also gearing up for the first day of Congressional testimony from Federal Reserve Chairman Jerome Powell in which he could talk up the strength of the economy.
At 05:29 GMT, March E-mini NASDAQ-100 Index futures are trading 9577.00, up 49.50 or +0.52%.
On Monday, the index rebounded from Friday’s setback, while negating a potentially bearish closing price reversal top. The move was fueled by a strong performance in tech shares such as Amazon, which rose 2.6% to a record high, breaking above $2,100 per share for the first time. Netflix and Alphabet both closed more than 1% higher while Facebook eked out a small gain. Tesla, meanwhile, continued to impress, adding more than 3% in another volatile session for the electric car maker.
At the same time, Apple shares fell as much as 1.9% on Monday amid concerns the outbreak will hurt production of the tech giant’s best-selling product, the iPhone.
Daily Swing Chart Technical Analysis
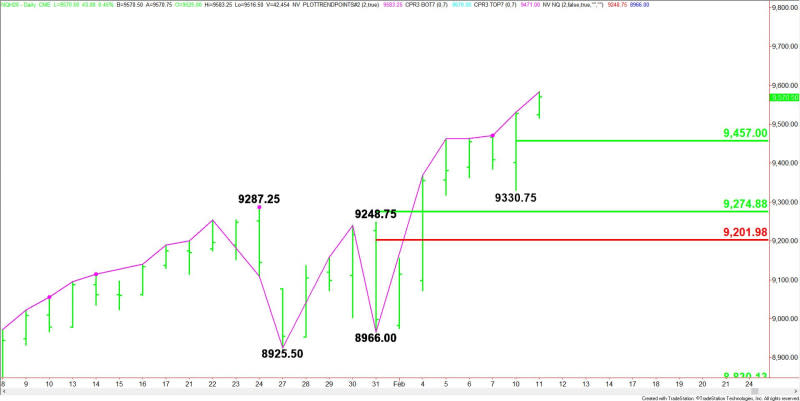
The main trend is up according to the daily swing chart. The trade through Monday’s high at 9531.50 signaled a resumption of the uptrend. There is no resistance at this time. The nearest main bottom is 8966.00. A trade through this level will change the main trend to down.
A change in trend is highly unlikely. However, the index is up seven sessions from its last main bottom which puts it inside the window of time for another closing price reversal top. This chart pattern won’t change the trend to down, but it could trigger the start of a 2 to 3 correction.
The minor trend is also up. A trade through 9330.75 will change the minor trend to down. This will also shift momentum to the downside.
The tentative minor range is 9330.75 to 9583.25. Its 50% level or pivot at 9457.00 is potential support.
Daily Swing Chart Technical Forecast
Based on the early price action and the current price at 9577.00, the direction of the March E-mini NASDAQ-100 Index the rest of the session on Tuesday will be determined by trader reaction to Monday’s close at 9527.50.
Bullish Scenario
A sustained move over 9527.50 will indicate the presence of buyers. There is no objective at this time since we are in uncharted territory.
Bearish Scenario
A sustained move under 9527.50 will signal the presence of sellers. Taking out the intraday low at 9516.50 will indicate the selling is getting stronger. This could trigger a further break into the pivot at 9457.00. Taking out this level could trigger an acceleration to the downside.
A daily close under 9527.50 will form a closing price reversal top.
This article was originally posted on FX Empire
