
 Yahoo Finance
 E-mini NASDAQ-100 Index (NQ) Futures Technical Analysis – January 28, 2019 Forecast
March E-mini NASDAQ-100 Index futures are trading lower early Monday as investors are showing little reaction to the announcement of the reopening of the U.S. government. Traders could be expressing a lack of trust in the government since the new deal only guarantees to keep the government open for three weeks. Furthermore, on Sunday, President Trump told The Wall Street Journal that another government shutdown is “certainly an option.”
At 0523 GMT, March E-mini NASDAQ-100 Index futures are trading 6773.00, down 18.25 or -0.27%.
Also on the watch list for technology traders is the news that three of the four biggest companies, Microsoft, Amazon and Apple, are set to report earnings this week.
Daily Technical Analysis
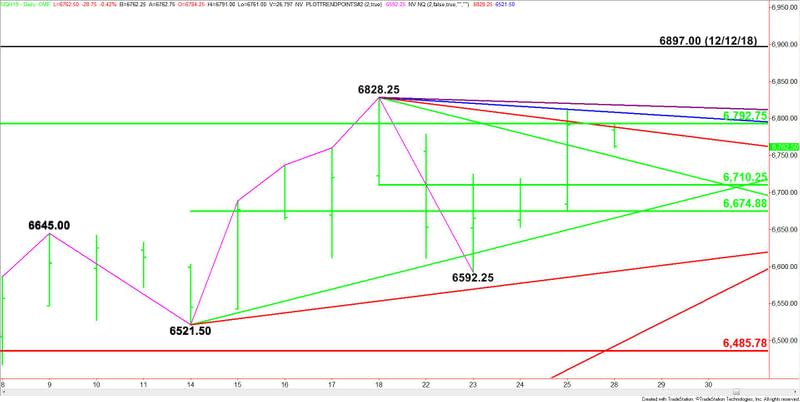
The main trend is up according to the daily swing chart. A trade through 6828.25 will signal a resumption of the uptrend. This will also turn 6592.25 into a new higher bottom. The main trend will change to down on a trade through 6521.50.
On the upside, the major retracement zone is 6792.75 to 7022.25. This zone is currently being tested. It is controlling the longer-term direction of the index.
The short-term range is 6828.25 to 6592.25. Its 50% level at 6710.25 is a potential downside target and support level.
The main range is 6521.50 to 6828.25. Its 50% level at 6674.75 is also a potential downside target and support level.
Daily Technical Forecast
Based on the early price action, the direction of the March E-mini NASDAQ-100 Index is likely to be determined by trader reaction to the major 50% level at 6792.75.
Bullish Scenario
Overtaking and sustaining a rally over 6792.75 will indicate the presence of buyers. This could lead to a labored rally with potential resistance angles coming in at 6808.25 and 6818.25. The latter is the last potential resistance angle before the 6828.25 main top.
The main top is a potential trigger point for an acceleration to the upside with the next main target the December 12 main top at 6897.00.
Bearish Scenario
A sustained move under 6792.75 will signal the presence of sellers. Crossing to the weak side of the downtrending Gann angle at 6788.25 will indicate the selling is getting stronger. This could drive the index into the next downtrending Gann angle at 6748.25.
Crossing to the weak side of the Gann angle at 6748.25 could trigger a sharp break into the 50% level at 6710.25, followed by another 50% level at 6674.75 and an uptrending Gann angle at 6665.50.
Overall, the problem for the bulls is attracting enough buying power to overcome the major 50% level at 6792.75. It may take bullish earnings reports from Microsoft, Amazon and Apple to accomplish this. Until then, the index could drift lower into support until it finds a value zone for buyers.
This article was originally posted on FX Empire
More From FXEMPIRE:
USD/JPY Fundamental Daily Forecast – No Surprises in BOJ Minutes, Focus on Fed Policy
Price of Gold Fundamental Daily Forecast – Bullish Bets Placed on Dovish Fed Policy Announcements
Crude Oil Price Update – Sentiment Could Turn Bearish if $52.49 Pivot Fails as Support
GBPUSD Price Forecast – Consolidative Action To Continue Ahead of Tomorrow’s Parliament Vote
Bitcoin Cash – ABC, Litecoin and Ripple Daily Analysis – 28/01/19
Oil Price Fundamental Daily Forecast – Jump in U.S. Rig Count Returns Supply Concerns to Forefront
