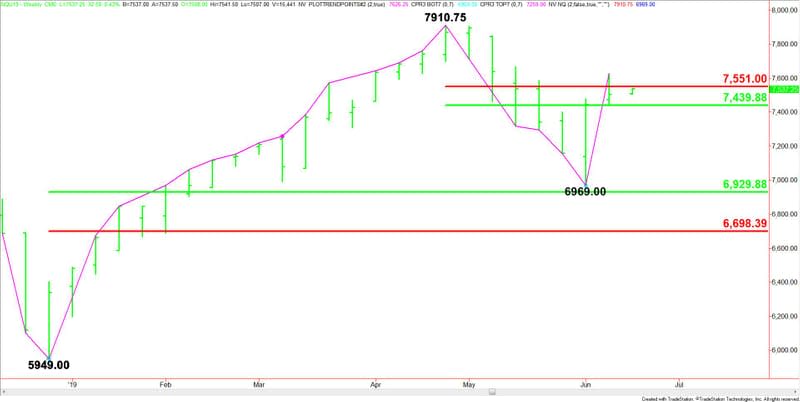
E-mini NASDAQ-100 Index (NQ) Futures Technical Analysis – Weekly Chart Strengthens Over 7551.00, Weakens Under 7439.75
September E-mini NASDAQ-100 Index futures settled higher last week, but well off their high. The market confirmed the previous week’s closing price reversal, but the close was inside a short-term retracement zone, which indicates a secondary lower top could still be forming.
The direction of the index this week is likely to be determined by the Federal Reserve’s interest rate decision and monetary policy statement. The Fed is not expected to raise rates at this meeting, but traders expect a rate cut in July and September. Look for the Fed to remove the word “patient” from its monetary policy statement. A dovish Fed could greenlight another rally this week.
Last week, September E-mini NASDAQ-100 Index futures settled at 7504.75, up 60.25 or +0.80%.

Weekly Technical Analysis
The main trend is up according to the daily swing chart. A trade through 6969.00 will change the main trend to down. A move through 7910.75 will signal a resumption of the uptrend.
The near-term range is 7910.75 to 6969.00. Its retracement zone at 7439.75 to 7551.00 is controlling the short-term direction of the index. This zone is important to the structure of the market. Taking out 7551.00 will indicate the buying is getting stronger. A failure at 7439.75 will indicate that sellers are retaking control. This could form a secondary lower top, which will signal a break is coming.
The main range is 5949.00 to 7910.75. If the trend changes to down then look for a test of its retracement zone at 6929.75 to 6698.25.
Weekly Technical Forecast
Based on last week’s price action and the close at 7504.75, the direction of the September E-mini NASDAQ-100 Index this week is likely to be determined by trader reaction to the Fibonacci level at 7551.00.
Bullish Scenario
Crossing to the strong side of the uptrending Gann angle at 7549.00 will be the first sign of strength. Overtaking the short-term Fibonacci level at 7551.00 will indicate the buying is getting stronger. This could trigger an acceleration into the next downtrending Gann angle at 7654.75. This is a potential trigger point for an acceleration into another pair of downtrending Gann angles at 7782.75 and 7846.75. The latter is the last potential resistance angle before the 7910.75 main top.
Bearish Scenario
The inability to overcome 7551.00 will signal the presence of sellers. A sustained move under 7549.00 will indicate the selling is getting stronger. Taking out the steep uptrending Gann angle at 7481.00 will be another sign of weakness with the next target the short-term 50% level at 7439.75.
The index will start to open up to the downside under 7439.75. Crossing to the weak side of the downtrending Gann angle at 7398.75 will be another sign of weakness with the next target an uptrending Gann angle at 7225.00. If this fails then look for the selling to possibly extend into uptrending Gann angles at 7097.00 and 7033.00. The latter is the last potential support angle before the 6969.00 main bottom.
Overview
Look for the upside bias to continue on a sustained move over 7551.00 and for a downside bias to develop on a sustained move under 7439.75.
This article was originally posted on FX Empire
More From FXEMPIRE:
GBP/USD Daily Price Forecast – Pound Consolidates Near May Lows
AUD/USD and NZD/USD Fundamental Weekly Forecast – RBA Minutes Likely to Support July Rate Cut
Price of Gold Fundamental Weekly Forecast – Euro Will Exert More Influence on Prices than Fed
USD/CAD Daily Forecast – Bulls to Breach the Green Ichimoku Clouds at 1.3422

 Yahoo Finance