
 Yahoo Finance
 E-mini NASDAQ-100 Index (NQ) Futures Technical Analysis – Ready to Test Major Retracement Zone at 6792.75 to 7022.25
An index of technology related stocks closed higher on Friday despite early concerns over a mixed earnings report from chipmaker Intel. The company reported better-than-expected fourth quarter earnings, but missed on revenue. Intel’s weakness was offset by solid gains in other tech giants such as Apple, Amazon, Google-parent Alphabet and Facebook.
On Friday, the March E-mini NASDAQ-100 Index settled at 6791.25, up 116.25 or +1.71%.
The index was also helped by the announcement of the reopening of the U.S. government after the 35 day partial shutdown weakened the economy. Traders also responded positively to a report from The Wall Street Journal which said the Fed was considering ending its balance sheet reduction scheme.
Daily Swing Chart Technical Analysis
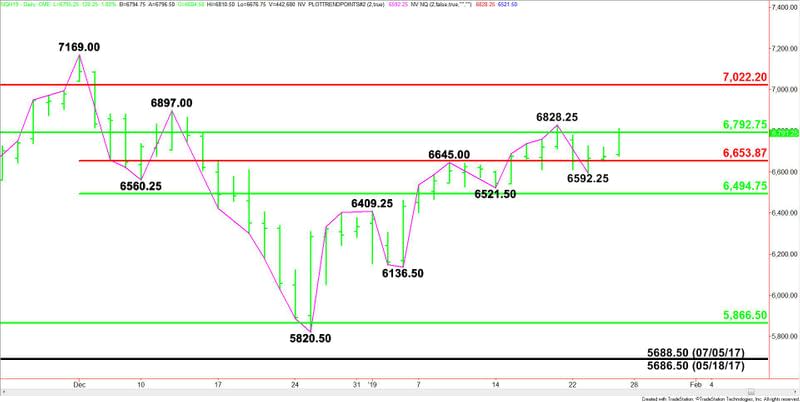
The main trend is up according to the daily swing chart. A trade through 6828.25 will signal a resumption of the uptrend. The main trend will change to down if the 6521.50 main bottom is taken out.
Before the opening, the minor trend is down. This is limiting the upside momentum. The minor trend will change to up if 6828.25 is taken out. This will also shift momentum to the upside.
The major retracement zone is 6792.75 to 7022.50. This zone is controlling the longer-term direction of the index. Currently, it is acting like resistance.
The main range is 7169.00 to 5820.50. Its retracement zone at 6653.75 to 6494.75 is support.
Daily Swing Chart Technical Forecast
Based on Friday’s close at 6792.75, the direction of the March E-mini NASDAQ-100 Index on Monday is likely to be determined by trader reaction to the major 50% level at 6792.75.
Bullish Scenario
A sustained move over 6792.75 will indicate the presence of buyers. This should lead to a quick test of the main top at 6828.25. Taking out this level could trigger a surge into the next main top at 6897.00. This is a potential trigger point for an acceleration into the Fibonacci level at 7022.25.
Bearish Scenario
A sustained move under 6792.75 will signal the presence of sellers. If this creates enough downside momentum then look for the selling to extend into the Fibonacci level at 6653.75. The break could extend if this level fails as support with last week’s low at 6592.25 the next target.
The key support area this week is 6521.50 to 6494.75. Look out to the downside if this area fails as support.
This article was originally posted on FX Empire
