
 Yahoo Finance
 E-mini Dow Jones Industrial Average (YM) Futures Technical Analysis – Big Test for Buyers at 25938 to 26298
September E-mini Dow Jones Industrial Average futures are edging higher in the pre-market session, shortly before the release of the U.S. Non-Farm Payrolls report at 12:30 GMT.
On Wednesday, the blue chip average started the new quarter with a loss despite solid gains in the benchmark S&P 500 Index and technology-based NASDAQ Composite with market sentiment getting a lift from positive coronavirus vaccine news and strong U.S. economic data.
At 08:52 GMT, September E-mini Dow Jones Industrial Average futures are trading 25847, up 272 or 1.06%.
In economic news, ADP and Moody’s Analytics said private payrolls jumped by 2.37 million in June. Payrolls for May were also revised to a gain of more than 3 million from a loss of 2.76 million.
Meanwhile, the Institute for Supply Management said U.S. manufacturing activity grew to its highest level since April 2019, recovering from a sharp contraction in May.
Additionally, the Federal Reserve’s June meeting minutes showed the central bank thinks the economy will need monetary policy support “for some time” as the country tries to recover from the pandemic.
Later today, June’s Non-Farm Payrolls report is expected to show an increase of around 3 million jobs according to analysts polled by Reuters. Last week’s jobless claims are also due at 12:30 GMT, with around 1.36 million unemployment filings expected after the previous week’s 1.48 million, along with the June unemployment rate and May’s balance of trade figures.
Daily Swing Chart Technical Analysis
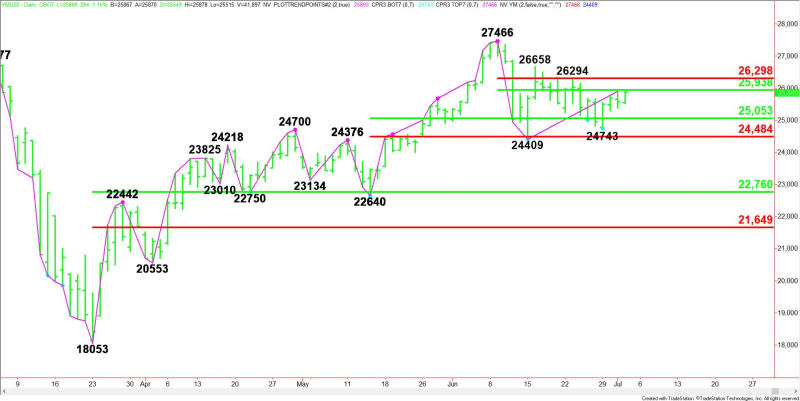
The main trend is up according to the daily swing chart. The main trend will change to down on a trade through 22640. A trade through 27466 will signal a resumption of the uptrend.
The minor trend is also up. A trade through 24409 will change the minor trend to down. This will also shift momentum to the downside. Taking out a pair of minor tops at 26294 and 26658 will indicate the buying is getting stronger.
The minor range is 27466 to 24409. Its retracement zone at 25938 to 26298 is potential resistance.
The short-term range is 22640 to 27466. Its retracement zone at 25053 to 24484 is potential support. This zone stopped the selling on Monday at 24743.
Daily Swing Chart Technical Forecast
Based on the early price action and the current price at 25847, the direction of the September E-mini Dow Jones Industrial Average the rest of the session on Thursday is likely to be determined by trader reaction to the 50% level at 25938.
Bullish Scenario
A sustained move over 25938 will indicate the presence of buyers. This could trigger a surge into the resistance cluster at 26294 to 26298.
Overtaking 26298 will indicate the buying is getting stronger. This could trigger a further rally into the next minor top at 26658. This is a potential trigger point for an acceleration into the main top at 27466.
Bearish Scenario
A sustained move under 25938 will signal the presence of sellers. If this creates enough downside momentum then look for the selling to possibly extend into the short-term retracement zone at 25053 to 24484.
The minor bottom at 24409 is a potential trigger point for an acceleration to the downside with the next target a support cluster at 22760 to 22640.
This article was originally posted on FX Empire
