
 Yahoo Finance
 Don't Sell Technology One Limited (ASX:TNE) Before You Read This

This article is for investors who would like to improve their understanding of price to earnings ratios (P/E ratios). To keep it practical, we'll show how Technology One Limited's (ASX:TNE) P/E ratio could help you assess the value on offer. Technology One has a P/E ratio of 37.28, based on the last twelve months. In other words, at today's prices, investors are paying A$37.28 for every A$1 in prior year profit.
Check out our latest analysis for Technology One
How Do You Calculate A P/E Ratio?
The formula for price to earnings is:
Price to Earnings Ratio = Share Price ÷ Earnings per Share (EPS)
Or for Technology One:
P/E of 37.28 = A$7.15 ÷ A$0.19 (Based on the year to March 2019.)
Is A High P/E Ratio Good?
A higher P/E ratio means that buyers have to pay a higher price for each A$1 the company has earned over the last year. That is not a good or a bad thing per se, but a high P/E does imply buyers are optimistic about the future.
How Does Technology One's P/E Ratio Compare To Its Peers?
The P/E ratio indicates whether the market has higher or lower expectations of a company. You can see in the image below that the average P/E (31.5) for companies in the software industry is lower than Technology One's P/E.
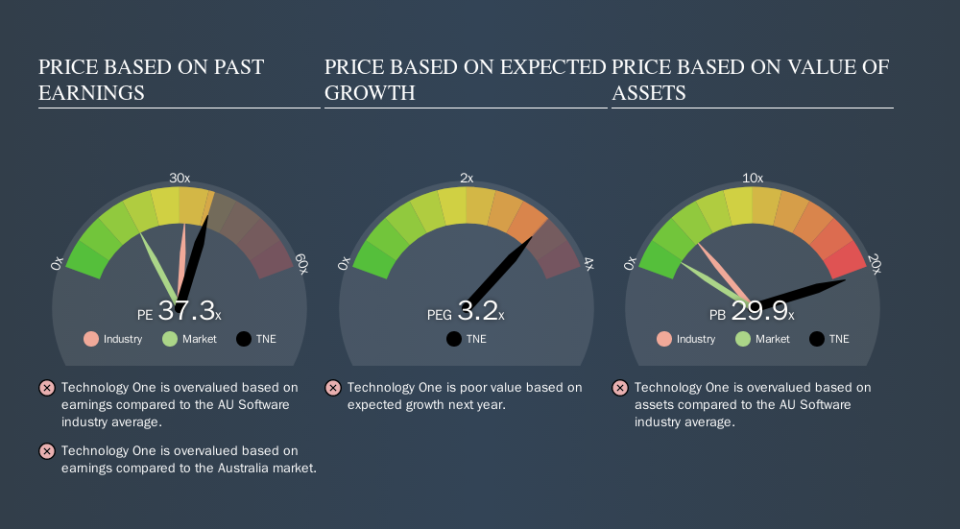
That means that the market expects Technology One will outperform other companies in its industry. Clearly the market expects growth, but it isn't guaranteed. So further research is always essential. I often monitor director buying and selling.
How Growth Rates Impact P/E Ratios
Generally speaking the rate of earnings growth has a profound impact on a company's P/E multiple. If earnings are growing quickly, then the 'E' in the equation will increase faster than it would otherwise. That means even if the current P/E is high, it will reduce over time if the share price stays flat. So while a stock may look expensive based on past earnings, it could be cheap based on future earnings.
Technology One increased earnings per share by a whopping 35% last year. And it has bolstered its earnings per share by 16% per year over the last five years. With that performance, I would expect it to have an above average P/E ratio.
Remember: P/E Ratios Don't Consider The Balance Sheet
Don't forget that the P/E ratio considers market capitalization. In other words, it does not consider any debt or cash that the company may have on the balance sheet. The exact same company would hypothetically deserve a higher P/E ratio if it had a strong balance sheet, than if it had a weak one with lots of debt, because a cashed up company can spend on growth.
Spending on growth might be good or bad a few years later, but the point is that the P/E ratio does not account for the option (or lack thereof).
So What Does Technology One's Balance Sheet Tell Us?
Since Technology One holds net cash of AU$68m, it can spend on growth, justifying a higher P/E ratio than otherwise.
The Verdict On Technology One's P/E Ratio
Technology One's P/E is 37.3 which is above average (18.4) in its market. The excess cash it carries is the gravy on top its fast EPS growth. To us, this is the sort of company that we would expect to carry an above average price tag (relative to earnings).
Investors should be looking to buy stocks that the market is wrong about. As value investor Benjamin Graham famously said, 'In the short run, the market is a voting machine but in the long run, it is a weighing machine. So this free visual report on analyst forecasts could hold the key to an excellent investment decision.
Of course, you might find a fantastic investment by looking at a few good candidates. So take a peek at this free list of companies with modest (or no) debt, trading on a P/E below 20.
We aim to bring you long-term focused research analysis driven by fundamental data. Note that our analysis may not factor in the latest price-sensitive company announcements or qualitative material.
If you spot an error that warrants correction, please contact the editor at editorial-team@simplywallst.com. This article by Simply Wall St is general in nature. It does not constitute a recommendation to buy or sell any stock, and does not take account of your objectives, or your financial situation. Simply Wall St has no position in the stocks mentioned. Thank you for reading.
