
 Yahoo Finance
 Don't Sell Baby Bunting Group Limited (ASX:BBN) Before You Read This

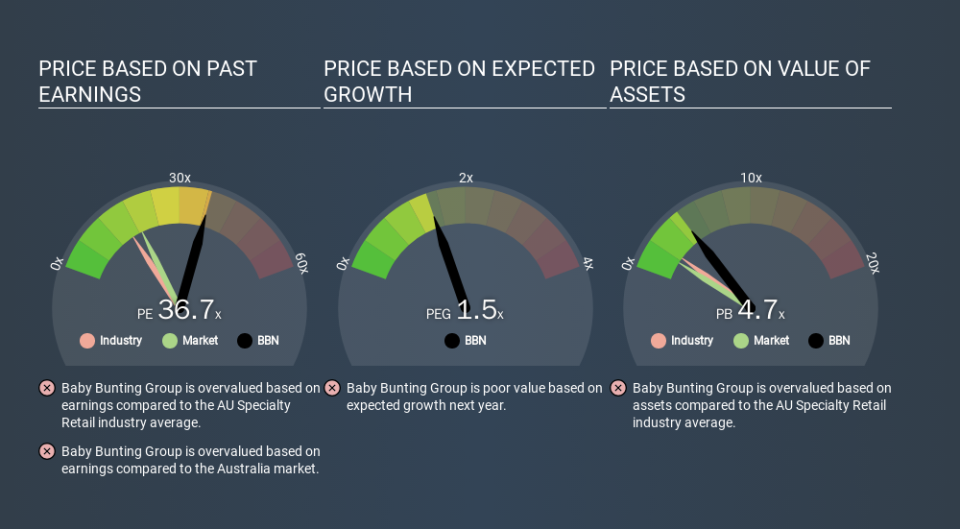
The goal of this article is to teach you how to use price to earnings ratios (P/E ratios). To keep it practical, we'll show how Baby Bunting Group Limited's (ASX:BBN) P/E ratio could help you assess the value on offer. Baby Bunting Group has a P/E ratio of 36.70, based on the last twelve months. That means that at current prices, buyers pay A$36.70 for every A$1 in trailing yearly profits.
View our latest analysis for Baby Bunting Group
How Do I Calculate A Price To Earnings Ratio?
The formula for price to earnings is:
Price to Earnings Ratio = Share Price ÷ Earnings per Share (EPS)
Or for Baby Bunting Group:
P/E of 36.70 = AUD3.61 ÷ AUD0.10 (Based on the trailing twelve months to June 2019.)
Is A High Price-to-Earnings Ratio Good?
A higher P/E ratio means that investors are paying a higher price for each AUD1 of company earnings. That is not a good or a bad thing per se, but a high P/E does imply buyers are optimistic about the future.
How Does Baby Bunting Group's P/E Ratio Compare To Its Peers?
The P/E ratio essentially measures market expectations of a company. You can see in the image below that the average P/E (15.9) for companies in the specialty retail industry is lower than Baby Bunting Group's P/E.
Baby Bunting Group's P/E tells us that market participants think the company will perform better than its industry peers, going forward. Clearly the market expects growth, but it isn't guaranteed. So further research is always essential. I often monitor director buying and selling.
How Growth Rates Impact P/E Ratios
Generally speaking the rate of earnings growth has a profound impact on a company's P/E multiple. That's because companies that grow earnings per share quickly will rapidly increase the 'E' in the equation. That means unless the share price increases, the P/E will reduce in a few years. Then, a lower P/E should attract more buyers, pushing the share price up.
Notably, Baby Bunting Group grew EPS by a whopping 43% in the last year. And it has bolstered its earnings per share by 18% per year over the last five years. With that performance, I would expect it to have an above average P/E ratio.
Remember: P/E Ratios Don't Consider The Balance Sheet
The 'Price' in P/E reflects the market capitalization of the company. So it won't reflect the advantage of cash, or disadvantage of debt. The exact same company would hypothetically deserve a higher P/E ratio if it had a strong balance sheet, than if it had a weak one with lots of debt, because a cashed up company can spend on growth.
Such spending might be good or bad, overall, but the key point here is that you need to look at debt to understand the P/E ratio in context.
Baby Bunting Group's Balance Sheet
The extra options and safety that comes with Baby Bunting Group's AU$2.7m net cash position means that it deserves a higher P/E than it would if it had a lot of net debt.
The Bottom Line On Baby Bunting Group's P/E Ratio
Baby Bunting Group's P/E is 36.7 which is above average (18.8) in its market. Its net cash position is the cherry on top of its superb EPS growth. So based on this analysis we'd expect Baby Bunting Group to have a high P/E ratio.
Investors should be looking to buy stocks that the market is wrong about. If the reality for a company is better than it expects, you can make money by buying and holding for the long term. So this free visual report on analyst forecasts could hold the key to an excellent investment decision.
You might be able to find a better buy than Baby Bunting Group. If you want a selection of possible winners, check out this free list of interesting companies that trade on a P/E below 20 (but have proven they can grow earnings).
If you spot an error that warrants correction, please contact the editor at editorial-team@simplywallst.com. This article by Simply Wall St is general in nature. It does not constitute a recommendation to buy or sell any stock, and does not take account of your objectives, or your financial situation. Simply Wall St has no position in the stocks mentioned.
We aim to bring you long-term focused research analysis driven by fundamental data. Note that our analysis may not factor in the latest price-sensitive company announcements or qualitative material. Thank you for reading.
