
 Yahoo Finance
 Don’t Sell Wagners Holding Company Limited (ASX:WGN) Before You Read This

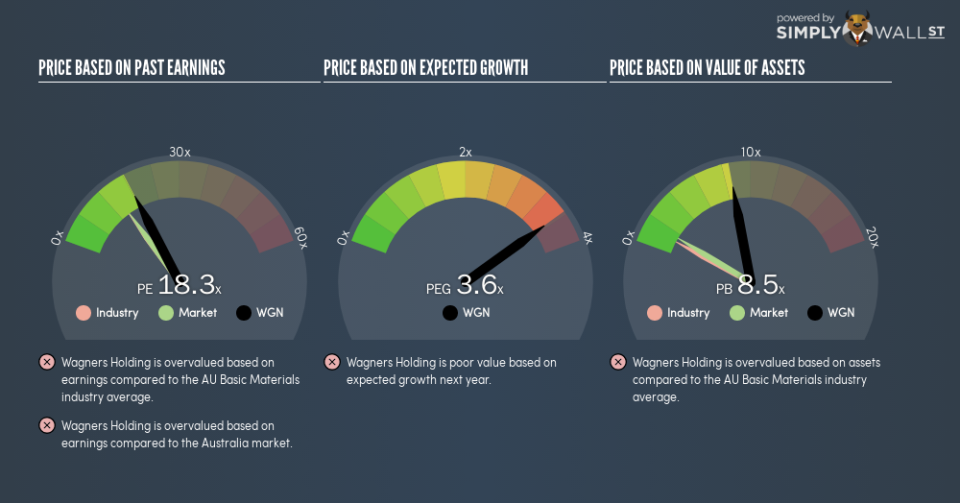
This article is written for those who want to get better at using price to earnings ratios (P/E ratios). To keep it practical, we’ll show how Wagners Holding Company Limited’s (ASX:WGN) P/E ratio could help you assess the value on offer. Based on the last twelve months, Wagners Holding’s P/E ratio is 18.26. That means that at current prices, buyers pay A$18.26 for every A$1 in trailing yearly profits.
See our latest analysis for Wagners Holding
How Do I Calculate A Price To Earnings Ratio?
The formula for P/E is:
Price to Earnings Ratio = Share Price ÷ Earnings per Share (EPS)
Or for Wagners Holding:
P/E of 18.26 = A$3.12 ÷ A$0.17 (Based on the year to June 2018.)
Is A High Price-to-Earnings Ratio Good?
A higher P/E ratio means that buyers have to pay a higher price for each A$1 the company has earned over the last year. That isn’t a good or a bad thing on its own, but a high P/E means that buyers have a higher opinion of the business’s prospects, relative to stocks with a lower P/E.
How Growth Rates Impact P/E Ratios
Probably the most important factor in determining what P/E a company trades on is the earnings growth. Earnings growth means that in the future the ‘E’ will be higher. Therefore, even if you pay a high multiple of earnings now, that multiple will become lower in the future. A lower P/E should indicate the stock is cheap relative to others — and that may attract buyers.
Most would be impressed by Wagners Holding earnings growth of 12% in the last year.
How Does Wagners Holding’s P/E Ratio Compare To Its Peers?
The P/E ratio indicates whether the market has higher or lower expectations of a company. As you can see below, Wagners Holding has a higher P/E than the average company (14.4) in the basic materials industry.
Wagners Holding’s P/E tells us that market participants think the company will perform better than its industry peers, going forward. The market is optimistic about the future, but that doesn’t guarantee future growth. So further research is always essential. I often monitor director buying and selling.
Don’t Forget: The P/E Does Not Account For Debt or Bank Deposits
It’s important to note that the P/E ratio considers the market capitalization, not the enterprise value. In other words, it does not consider any debt or cash that the company may have on the balance sheet. In theory, a company can lower its future P/E ratio by using cash or debt to invest in growth.
Spending on growth might be good or bad a few years later, but the point is that the P/E ratio does not account for the option (or lack thereof).
Is Debt Impacting Wagners Holding’s P/E?
Net debt totals 16% of Wagners Holding’s market cap. This could bring some additional risk, and reduce the number of investment options for management; worth remembering if you compare its P/E to businesses without debt.
The Verdict On Wagners Holding’s P/E Ratio
Wagners Holding’s P/E is 18.3 which is above average (14.5) in the AU market. While the company does use modest debt, its recent earnings growth is impressive. Therefore it seems reasonable that the market would have relatively high expectations of the company
Investors should be looking to buy stocks that the market is wrong about. If the reality for a company is better than it expects, you can make money by buying and holding for the long term. So this free report on the analyst consensus forecasts could help you make a master move on this stock.
You might be able to find a better buy than Wagners Holding. If you want a selection of possible winners, check out this free list of interesting companies that trade on a P/E below 20 (but have proven they can grow earnings).
To help readers see past the short term volatility of the financial market, we aim to bring you a long-term focused research analysis purely driven by fundamental data. Note that our analysis does not factor in the latest price-sensitive company announcements.
The author is an independent contributor and at the time of publication had no position in the stocks mentioned. For errors that warrant correction please contact the editor at editorial-team@simplywallst.com.
