
 Yahoo Finance
 Dollar Tries to Form a Bottom as SPX 500 Hovers Near 2013 Top
Talking Points:
US Dollar Trying to Rise After First Positive Close in Feb
S&P 500 Still Treading Water Below 2013 Yearly High
Crude Oil Tops Dec’13 High, Gold Recoils at Trend Line
Can’t access to the Dow Jones FXCM US Dollar Index? Try the USD basket on Mirror Trader. **
US DOLLAR TECHNICAL ANALYSIS – Prices are edging higher after putting a Hammer candlestick. Initial resistance is at 10576, the 23.6% Fibonacci retracement, with a break above that exposing the 38.2% level at 10610. Near-term support is at 10520, the February 17 swing low.
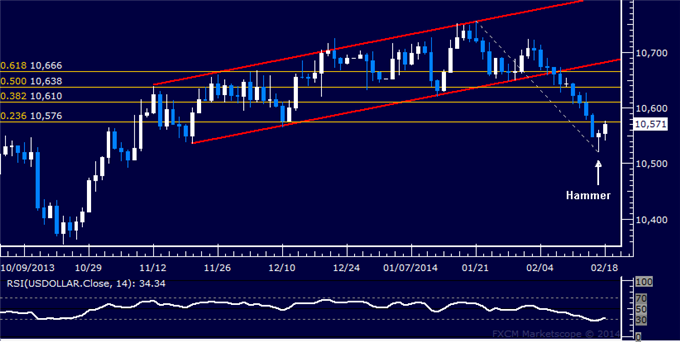
Daily Chart - Created Using FXCM Marketscope 2.0
** The Dow Jones FXCM US Dollar Index and the Mirror Trader USD basket are not the same product.
S&P 500 TECHNICAL ANALYSIS – Prices are in the midst of the longest string of consecutive daily gains in seven months. Buyers are testing resistance in the 1840.20-47.90 area, marked by the 50% Fibonacci expansion and the index’s 2013 closing high. Breaking above this boundary initially targets the 61.8% level at 1864.30. Alternatively, a reversal below support in the 1805.70-20.60 area aims for a horizontal pivot level at 1773.40.
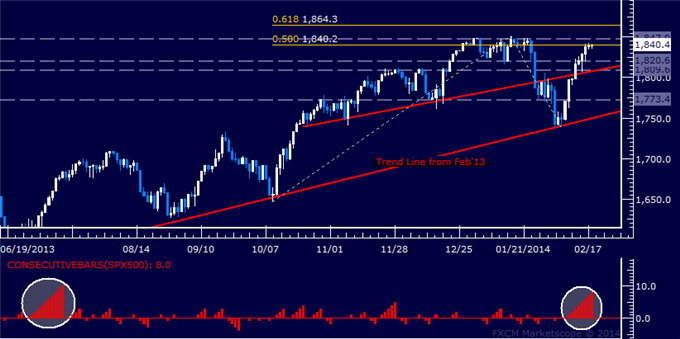
Daily Chart - Created Using FXCM Marketscope 2.0
GOLD TECHNICAL ANALYSIS – Prices are recoiling from trend line resistance set from April 2013. A break below initial support at 1295.85, the 23.6% Fibonacci retracement, exposes the 38.2% level at 1273.49. Trend line resistance is currently at 1328.07.
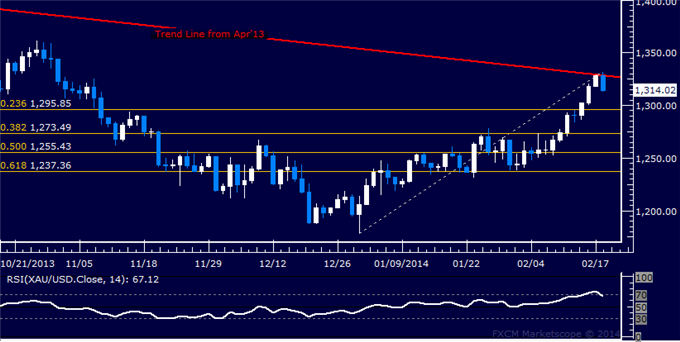
Daily Chart - Created Using FXCM Marketscope 2.0
CRUDE OIL TECHNICAL ANALYSIS – Prices narrowly edged above resistance at 100.73, the December 27 high, exposing the February 12 top at 101.36 and the 76.4% Fibonacci expansion at 101.86. A break above the latter level exposes the 100% level at 103.59. Alternatively, move back below 100.73 sees initial support at 99.88, the 14.6% Fib retracement.
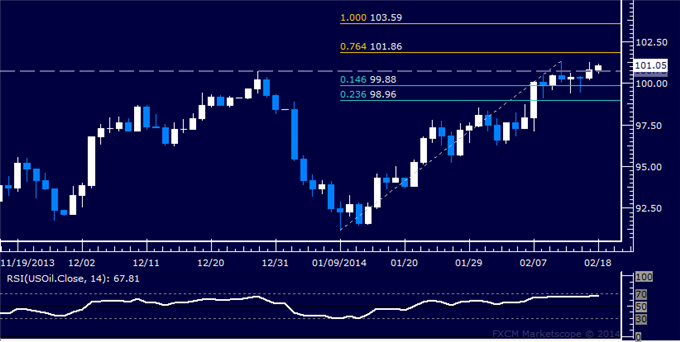
Daily Chart - Created Using FXCM Marketscope 2.0
--- Written by Ilya Spivak, Currency Strategist for DailyFX.com
To receive Ilya's analysis directly via email, please SIGN UP HERE
Contact and follow Ilya on Twitter: @IlyaSpivak
DailyFX provides forex news and technical analysis on the trends that influence the global currency markets.
Learn forex trading with a free practice account and trading charts from FXCM.
