
 Yahoo Finance
 Does WEC Energy Group, Inc. (NYSE:WEC) Create Value For Shareholders?

Today we'll look at WEC Energy Group, Inc. (NYSE:WEC) and reflect on its potential as an investment. Specifically, we'll consider its Return On Capital Employed (ROCE), since that will give us an insight into how efficiently the business can generate profits from the capital it requires.
First, we'll go over how we calculate ROCE. Second, we'll look at its ROCE compared to similar companies. Finally, we'll look at how its current liabilities affect its ROCE.
What is Return On Capital Employed (ROCE)?
ROCE is a metric for evaluating how much pre-tax income (in percentage terms) a company earns on the capital invested in its business. In general, businesses with a higher ROCE are usually better quality. Ultimately, it is a useful but imperfect metric. Renowned investment researcher Michael Mauboussin has suggested that a high ROCE can indicate that 'one dollar invested in the company generates value of more than one dollar'.
So, How Do We Calculate ROCE?
The formula for calculating the return on capital employed is:
Return on Capital Employed = Earnings Before Interest and Tax (EBIT) ÷ (Total Assets - Current Liabilities)
Or for WEC Energy Group:
0.048 = US$1.5b ÷ (US$34b - US$3.4b) (Based on the trailing twelve months to June 2019.)
So, WEC Energy Group has an ROCE of 4.8%.
See our latest analysis for WEC Energy Group
Does WEC Energy Group Have A Good ROCE?
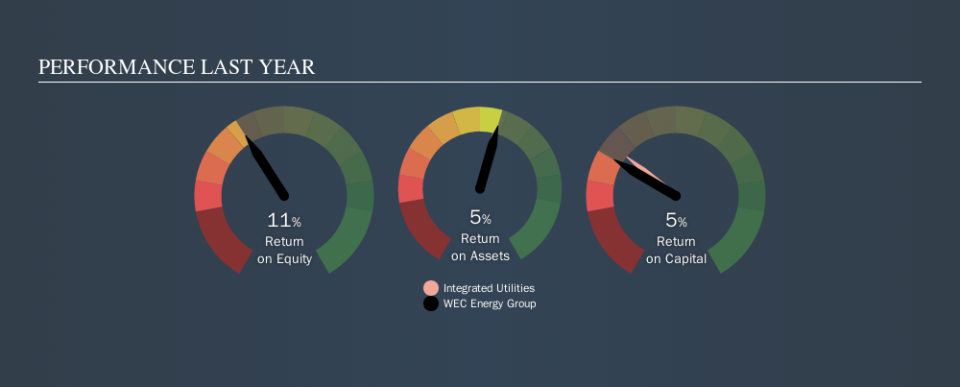
ROCE is commonly used for comparing the performance of similar businesses. Using our data, WEC Energy Group's ROCE appears to be around the 4.9% average of the Integrated Utilities industry. Regardless of how WEC Energy Group stacks up against its industry, its ROCE in absolute terms is quite low (especially compared to a bank account). It is likely that there are more attractive prospects out there.
You can see in the image below how WEC Energy Group's ROCE compares to its industry. Click to see more on past growth.
When considering this metric, keep in mind that it is backwards looking, and not necessarily predictive. Companies in cyclical industries can be difficult to understand using ROCE, as returns typically look high during boom times, and low during busts. ROCE is, after all, simply a snap shot of a single year. What happens in the future is pretty important for investors, so we have prepared a free report on analyst forecasts for WEC Energy Group.
How WEC Energy Group's Current Liabilities Impact Its ROCE
Current liabilities are short term bills and invoices that need to be paid in 12 months or less. Due to the way ROCE is calculated, a high level of current liabilities makes a company look as though it has less capital employed, and thus can (sometimes unfairly) boost the ROCE. To counteract this, we check if a company has high current liabilities, relative to its total assets.
WEC Energy Group has total assets of US$34b and current liabilities of US$3.4b. Therefore its current liabilities are equivalent to approximately 9.9% of its total assets. With barely any current liabilities, there is minimal impact on WEC Energy Group's admittedly low ROCE.
The Bottom Line On WEC Energy Group's ROCE
Nevertheless, there are potentially more attractive companies to invest in. Of course, you might find a fantastic investment by looking at a few good candidates. So take a peek at this free list of companies with modest (or no) debt, trading on a P/E below 20.
I will like WEC Energy Group better if I see some big insider buys. While we wait, check out this free list of growing companies with considerable, recent, insider buying.
We aim to bring you long-term focused research analysis driven by fundamental data. Note that our analysis may not factor in the latest price-sensitive company announcements or qualitative material.
If you spot an error that warrants correction, please contact the editor at editorial-team@simplywallst.com. This article by Simply Wall St is general in nature. It does not constitute a recommendation to buy or sell any stock, and does not take account of your objectives, or your financial situation. Simply Wall St has no position in the stocks mentioned. Thank you for reading.
