
 Yahoo Finance
 How Does Viasat, Inc. (NASDAQ:VSAT) Affect Your Portfolio Volatility?

If you own shares in Viasat, Inc. (NASDAQ:VSAT) then it's worth thinking about how it contributes to the volatility of your portfolio, overall. In finance, Beta is a measure of volatility. Modern finance theory considers volatility to be a measure of risk, and there are two main types of price volatility. The first type is company specific volatility. Investors use diversification across uncorrelated stocks to reduce this kind of price volatility across the portfolio. The other type, which cannot be diversified away, is the volatility of the entire market. Every stock in the market is exposed to this volatility, which is linked to the fact that stocks prices are correlated in an efficient market.
Some stocks mimic the volatility of the market quite closely, while others demonstrate muted, exagerrated or uncorrelated price movements. Beta is a widely used metric to measure a stock's exposure to market risk (volatility). Before we go on, it's worth noting that Warren Buffett pointed out in his 2014 letter to shareholders that 'volatility is far from synonymous with risk.' Having said that, beta can still be rather useful. The first thing to understand about beta is that the beta of the overall market is one. A stock with a beta below one is either less volatile than the market, or more volatile but not corellated with the overall market. In comparison a stock with a beta of over one tends to be move in a similar direction to the market in the long term, but with greater changes in price.
View our latest analysis for Viasat
What we can learn from VSAT's beta value
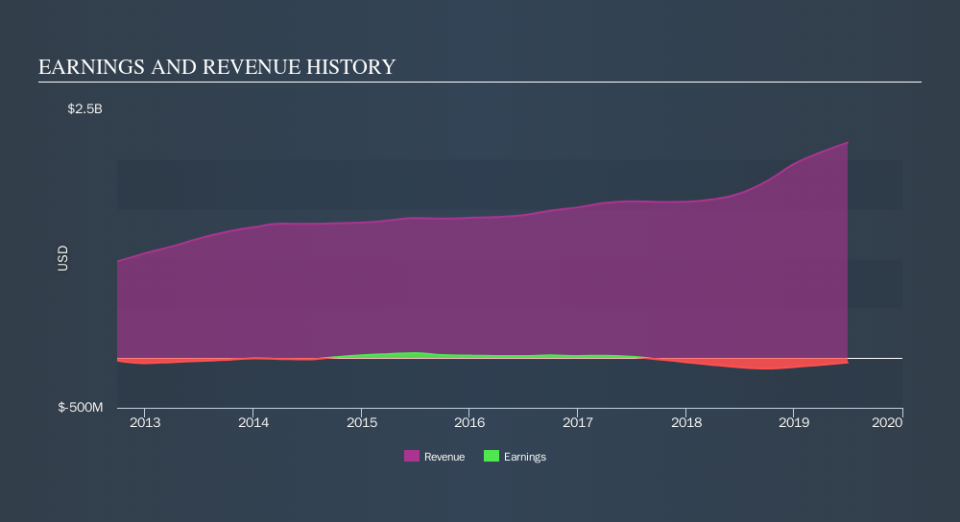
Zooming in on Viasat, we see it has a five year beta of 0.88. This is below 1, so historically its share price has been rather independent from the market. This means that -- if history is a guide -- buying the stock would reduce the impact of overall market volatility in many portfolios (depending on the beta of the portfolio, of course). Beta is worth considering, but it's also important to consider whether Viasat is growing earnings and revenue. You can take a look for yourself, below.
Could VSAT's size cause it to be more volatile?
Viasat is a fairly large company. It has a market capitalisation of US$4.8b, which means it is probably on the radar of most investors. It is a little unusual to see big companies like this trade on low beta values. Oftentimes there is some other clear influence on the share price, overshadowing market volatility.
What this means for you:
The Viasat doesn't usually show much sensitivity to the broader market. This could be for a variety of reasons. Typically, smaller companies have a low beta if their share price tends to move a lot due to company specific developments. Alternatively, an strong dividend payer might move less than the market because investors are valuing it for its income stream. In order to fully understand whether VSAT is a good investment for you, we also need to consider important company-specific fundamentals such as Viasat’s financial health and performance track record. I highly recommend you dive deeper by considering the following:
Future Outlook: What are well-informed industry analysts predicting for VSAT’s future growth? Take a look at our free research report of analyst consensus for VSAT’s outlook.
Past Track Record: Has VSAT been consistently performing well irrespective of the ups and downs in the market? Go into more detail in the past performance analysis and take a look at the free visual representations of VSAT's historicals for more clarity.
Other Interesting Stocks: It's worth checking to see how VSAT measures up against other companies on valuation. You could start with this free list of prospective options.
We aim to bring you long-term focused research analysis driven by fundamental data. Note that our analysis may not factor in the latest price-sensitive company announcements or qualitative material.
If you spot an error that warrants correction, please contact the editor at editorial-team@simplywallst.com. This article by Simply Wall St is general in nature. It does not constitute a recommendation to buy or sell any stock, and does not take account of your objectives, or your financial situation. Simply Wall St has no position in the stocks mentioned. Thank you for reading.
