
 Yahoo Finance
 Does Spire Inc. (NYSE:SR) Create Value For Shareholders?

Many investors are still learning about the various metrics that can be useful when analysing a stock. This article is for those who would like to learn about Return On Equity (ROE). To keep the lesson grounded in practicality, we'll use ROE to better understand Spire Inc. (NYSE:SR).
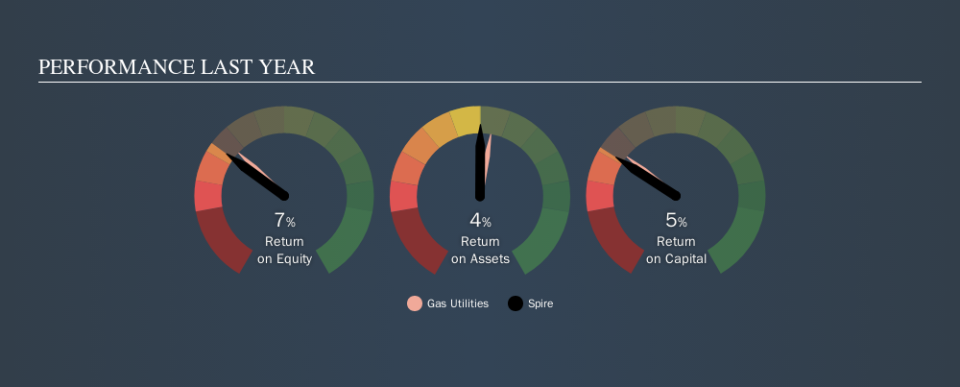
Our data shows Spire has a return on equity of 7.4% for the last year. Another way to think of that is that for every $1 worth of equity in the company, it was able to earn $0.07.
View our latest analysis for Spire
How Do I Calculate ROE?
The formula for return on equity is:
Return on Equity = Net Profit ÷ Shareholders' Equity
Or for Spire:
7.4% = US$191m ÷ US$2.6b (Based on the trailing twelve months to June 2019.)
Most readers would understand what net profit is, but it’s worth explaining the concept of shareholders’ equity. It is all earnings retained by the company, plus any capital paid in by shareholders. You can calculate shareholders' equity by subtracting the company's total liabilities from its total assets.
What Does Return On Equity Signify?
ROE measures a company's profitability against the profit it retains, and any outside investments. The 'return' is the profit over the last twelve months. That means that the higher the ROE, the more profitable the company is. So, all else equal, investors should like a high ROE. Clearly, then, one can use ROE to compare different companies.
Does Spire Have A Good ROE?
One simple way to determine if a company has a good return on equity is to compare it to the average for its industry. The limitation of this approach is that some companies are quite different from others, even within the same industry classification. If you look at the image below, you can see Spire has a similar ROE to the average in the Gas Utilities industry classification (8.5%).
That isn't amazing, but it is respectable. ROE doesn't tell us if the share price is low, but it can inform us to the nature of the business. For those looking for a bargain, other factors may be more important. I will like Spire better if I see some big insider buys. While we wait, check out this free list of growing companies with considerable, recent, insider buying.
The Importance Of Debt To Return On Equity
Companies usually need to invest money to grow their profits. The cash for investment can come from prior year profits (retained earnings), issuing new shares, or borrowing. In the first two cases, the ROE will capture this use of capital to grow. In the latter case, the use of debt will improve the returns, but will not change the equity. That will make the ROE look better than if no debt was used.
Combining Spire's Debt And Its 7.4% Return On Equity
It's worth noting the significant use of debt by Spire, leading to its debt to equity ratio of 1.01. Its ROE isn't too bad, but it would probably be very disappointing if the company had to stop using debt. Investors should think carefully about how a company might perform if it was unable to borrow so easily, because credit markets do change over time.
The Key Takeaway
Return on equity is one way we can compare the business quality of different companies. A company that can achieve a high return on equity without debt could be considered a high quality business. All else being equal, a higher ROE is better.
Having said that, while ROE is a useful indicator of business quality, you'll have to look at a whole range of factors to determine the right price to buy a stock. The rate at which profits are likely to grow, relative to the expectations of profit growth reflected in the current price, must be considered, too. So you might want to check this FREE visualization of analyst forecasts for the company.
If you would prefer check out another company -- one with potentially superior financials -- then do not miss thisfree list of interesting companies, that have HIGH return on equity and low debt.
We aim to bring you long-term focused research analysis driven by fundamental data. Note that our analysis may not factor in the latest price-sensitive company announcements or qualitative material.
If you spot an error that warrants correction, please contact the editor at editorial-team@simplywallst.com. This article by Simply Wall St is general in nature. It does not constitute a recommendation to buy or sell any stock, and does not take account of your objectives, or your financial situation. Simply Wall St has no position in the stocks mentioned. Thank you for reading.
