
 Yahoo Finance
 How Does SeSa's (BIT:SES) P/E Compare To Its Industry, After Its Big Share Price Gain?

Those holding SeSa (BIT:SES) shares must be pleased that the share price has rebounded 30% in the last thirty days. But unfortunately, the stock is still down by 9.6% over a quarter. That brought the twelve month gain to a very sharp 69%.
All else being equal, a sharp share price increase should make a stock less attractive to potential investors. In the long term, share prices tend to follow earnings per share, but in the short term prices bounce around in response to short term factors (which are not always obvious). So some would prefer to hold off buying when there is a lot of optimism towards a stock. Perhaps the simplest way to get a read on investors' expectations of a business is to look at its Price to Earnings Ratio (PE Ratio). A high P/E implies that investors have high expectations of what a company can achieve compared to a company with a low P/E ratio.
See our latest analysis for SeSa
How Does SeSa's P/E Ratio Compare To Its Peers?
SeSa's P/E of 21.79 indicates some degree of optimism towards the stock. As you can see below, SeSa has a higher P/E than the average company (12.3) in the electronic industry.
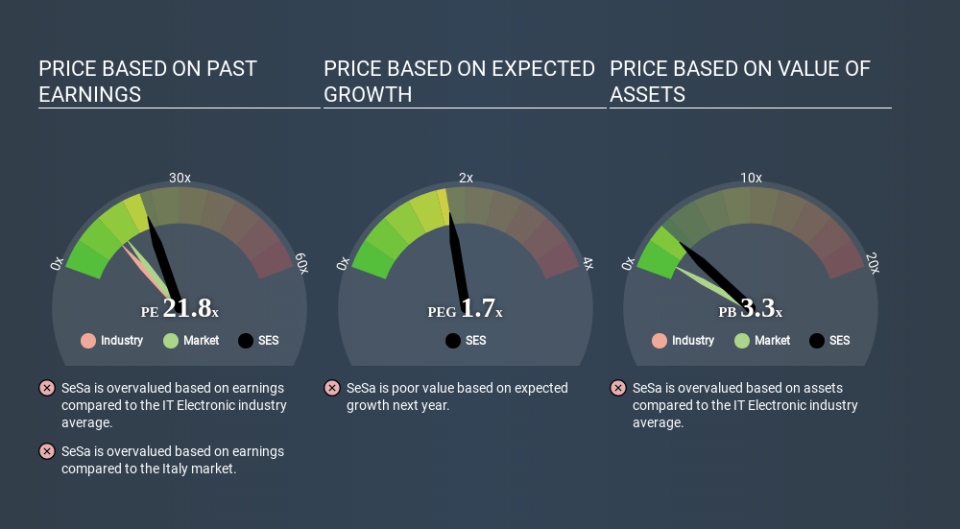
SeSa's P/E tells us that market participants think the company will perform better than its industry peers, going forward. The market is optimistic about the future, but that doesn't guarantee future growth. So investors should always consider the P/E ratio alongside other factors, such as whether company directors have been buying shares.
How Growth Rates Impact P/E Ratios
Generally speaking the rate of earnings growth has a profound impact on a company's P/E multiple. If earnings are growing quickly, then the 'E' in the equation will increase faster than it would otherwise. That means unless the share price increases, the P/E will reduce in a few years. Then, a lower P/E should attract more buyers, pushing the share price up.
It's great to see that SeSa grew EPS by 19% in the last year.
A Limitation: P/E Ratios Ignore Debt and Cash In The Bank
Don't forget that the P/E ratio considers market capitalization. In other words, it does not consider any debt or cash that the company may have on the balance sheet. Hypothetically, a company could reduce its future P/E ratio by spending its cash (or taking on debt) to achieve higher earnings.
While growth expenditure doesn't always pay off, the point is that it is a good option to have; but one that the P/E ratio ignores.
So What Does SeSa's Balance Sheet Tell Us?
The extra options and safety that comes with SeSa's €18m net cash position means that it deserves a higher P/E than it would if it had a lot of net debt.
The Bottom Line On SeSa's P/E Ratio
SeSa trades on a P/E ratio of 21.8, which is above its market average of 14.1. Its strong balance sheet gives the company plenty of resources for extra growth, and it has already proven it can grow. So it is not surprising the market is probably extrapolating recent growth well into the future, reflected in the relatively high P/E ratio. What we know for sure is that investors have become much more excited about SeSa recently, since they have pushed its P/E ratio from 16.7 to 21.8 over the last month. For those who prefer to invest with the flow of momentum, that might mean it's time to put the stock on a watchlist, or research it. But the contrarian may see it as a missed opportunity.
Investors should be looking to buy stocks that the market is wrong about. If the reality for a company is better than it expects, you can make money by buying and holding for the long term. So this free visual report on analyst forecasts could hold the key to an excellent investment decision.
Of course, you might find a fantastic investment by looking at a few good candidates. So take a peek at this free list of companies with modest (or no) debt, trading on a P/E below 20.
If you spot an error that warrants correction, please contact the editor at editorial-team@simplywallst.com. This article by Simply Wall St is general in nature. It does not constitute a recommendation to buy or sell any stock, and does not take account of your objectives, or your financial situation. Simply Wall St has no position in the stocks mentioned.
We aim to bring you long-term focused research analysis driven by fundamental data. Note that our analysis may not factor in the latest price-sensitive company announcements or qualitative material. Thank you for reading.
