
 Yahoo Finance
 Does Sabre Corporation (NASDAQ:SABR) Have A Good P/E Ratio?

The goal of this article is to teach you how to use price to earnings ratios (P/E ratios). We'll look at Sabre Corporation's (NASDAQ:SABR) P/E ratio and reflect on what it tells us about the company's share price. Sabre has a price to earnings ratio of 26.58, based on the last twelve months. That corresponds to an earnings yield of approximately 3.8%.
View our latest analysis for Sabre
How Do I Calculate A Price To Earnings Ratio?
The formula for P/E is:
Price to Earnings Ratio = Share Price ÷ Earnings per Share (EPS)
Or for Sabre:
P/E of 26.58 = $22.74 ÷ $0.86 (Based on the trailing twelve months to September 2019.)
Is A High P/E Ratio Good?
A higher P/E ratio implies that investors pay a higher price for the earning power of the business. That isn't necessarily good or bad, but a high P/E implies relatively high expectations of what a company can achieve in the future.
Does Sabre Have A Relatively High Or Low P/E For Its Industry?
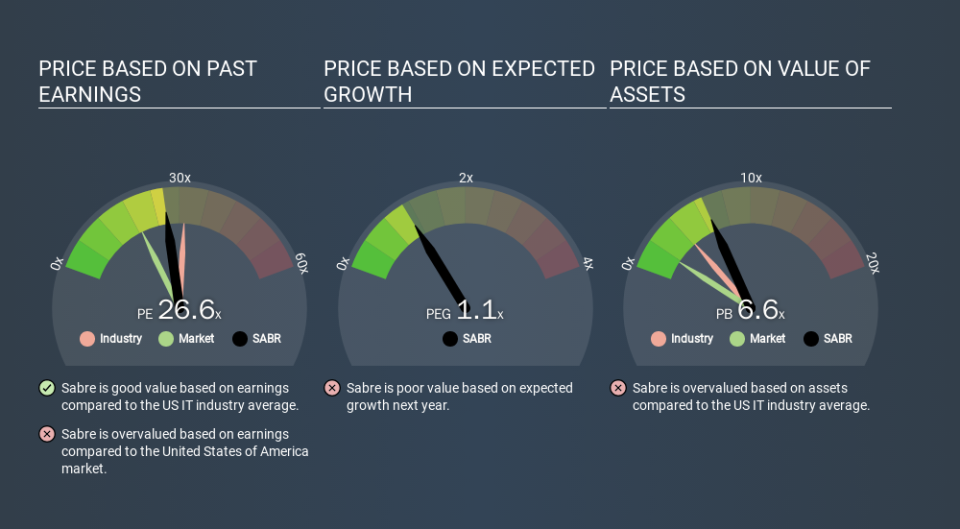
One good way to get a quick read on what market participants expect of a company is to look at its P/E ratio. The image below shows that Sabre has a lower P/E than the average (31.4) P/E for companies in the it industry.
Its relatively low P/E ratio indicates that Sabre shareholders think it will struggle to do as well as other companies in its industry classification. Since the market seems unimpressed with Sabre, it's quite possible it could surprise on the upside. It is arguably worth checking if insiders are buying shares, because that might imply they believe the stock is undervalued.
How Growth Rates Impact P/E Ratios
P/E ratios primarily reflect market expectations around earnings growth rates. Earnings growth means that in the future the 'E' will be higher. And in that case, the P/E ratio itself will drop rather quickly. And as that P/E ratio drops, the company will look cheap, unless its share price increases.
Sabre shrunk earnings per share by 29% over the last year. And EPS is down 1.7% a year, over the last 5 years. This growth rate might warrant a below average P/E ratio.
A Limitation: P/E Ratios Ignore Debt and Cash In The Bank
Don't forget that the P/E ratio considers market capitalization. Thus, the metric does not reflect cash or debt held by the company. In theory, a company can lower its future P/E ratio by using cash or debt to invest in growth.
Such expenditure might be good or bad, in the long term, but the point here is that the balance sheet is not reflected by this ratio.
Sabre's Balance Sheet
Sabre's net debt equates to 47% of its market capitalization. While that's enough to warrant consideration, it doesn't really concern us.
The Bottom Line On Sabre's P/E Ratio
Sabre has a P/E of 26.6. That's higher than the average in its market, which is 18.9. With some debt but no EPS growth last year, the market has high expectations of future profits.
When the market is wrong about a stock, it gives savvy investors an opportunity. If the reality for a company is better than it expects, you can make money by buying and holding for the long term. So this free visual report on analyst forecasts could hold the key to an excellent investment decision.
Of course you might be able to find a better stock than Sabre. So you may wish to see this free collection of other companies that have grown earnings strongly.
If you spot an error that warrants correction, please contact the editor at editorial-team@simplywallst.com. This article by Simply Wall St is general in nature. It does not constitute a recommendation to buy or sell any stock, and does not take account of your objectives, or your financial situation. Simply Wall St has no position in the stocks mentioned.
We aim to bring you long-term focused research analysis driven by fundamental data. Note that our analysis may not factor in the latest price-sensitive company announcements or qualitative material. Thank you for reading.
