
 Yahoo Finance
 Does Royal Caribbean Cruises Ltd’s (NYSE:RCL) Past Performance Indicate A Stronger Future?

For investors with a long-term horizon, assessing earnings trend over time and against industry benchmarks is more valuable than looking at a single earnings announcement in one point in time. Investors may find my commentary, albeit very high-level and brief, on Royal Caribbean Cruises Ltd (NYSE:RCL) useful as an attempt to give more color around how Royal Caribbean Cruises is currently performing.
See our latest analysis for Royal Caribbean Cruises
Did RCL beat its long-term earnings growth trend and its industry?
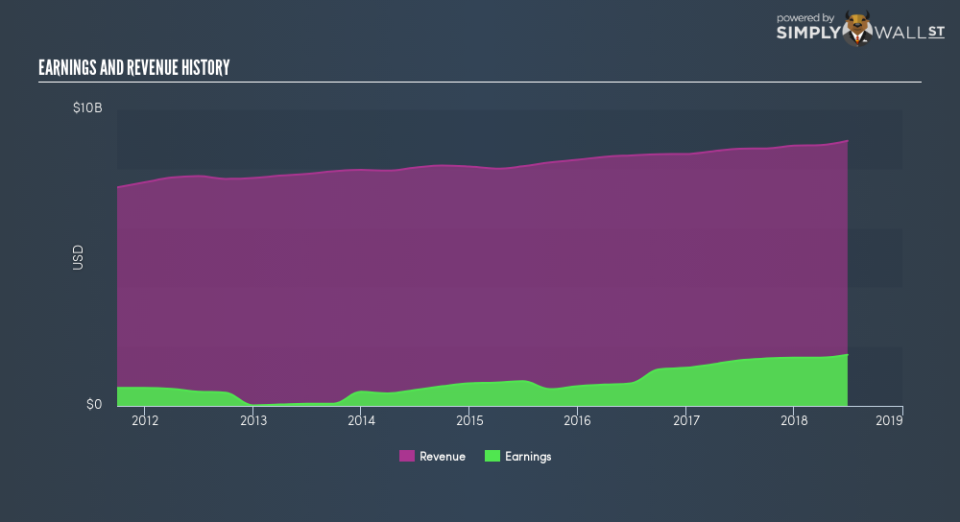
RCL’s trailing twelve-month earnings (from 30 June 2018) of US$1.73b has jumped 12.17% compared to the previous year. However, this one-year growth rate has been lower than its average earnings growth rate over the past 5 years of 26.77%, indicating the rate at which RCL is growing has slowed down. To understand what’s happening, let’s take a look at what’s occurring with margins and whether the entire industry is facing the same headwind.
Over the last couple of years, revenue growth has not been able to catch up, which implies that Royal Caribbean Cruises’s bottom line has been driven by unsustainable cost-cutting. Viewing growth from a sector-level, the US hospitality industry has been growing its average earnings by double-digit 19.00% in the previous twelve months, and 12.20% over the past half a decade. This growth is a median of profitable companies of 25 Hospitality companies in US including Melco International Development, Famous Brands and Golden Entertainment. This means any uplift the industry is benefiting from, Royal Caribbean Cruises has not been able to leverage it as much as its average peer.
In terms of returns from investment, Royal Caribbean Cruises has fallen short of achieving a 20% return on equity (ROE), recording 16.02% instead. However, its return on assets (ROA) of 8.23% exceeds the US Hospitality industry of 7.12%, indicating Royal Caribbean Cruises has used its assets more efficiently. And finally, its return on capital (ROC), which also accounts for Royal Caribbean Cruises’s debt level, has increased over the past 3 years from 4.95% to 9.42%. This correlates with a decrease in debt holding, with debt-to-equity ratio declining from 99.30% to 79.55% over the past 5 years.
What does this mean?
Royal Caribbean Cruises’s track record can be a valuable insight into its earnings performance, but it certainly doesn’t tell the whole story. Companies that have performed well in the past, such as Royal Caribbean Cruises gives investors conviction. However, the next step would be to assess whether the future looks as optimistic. I recommend you continue to research Royal Caribbean Cruises to get a more holistic view of the stock by looking at:
Future Outlook: What are well-informed industry analysts predicting for RCL’s future growth? Take a look at our free research report of analyst consensus for RCL’s outlook.
Financial Health: Are RCL’s operations financially sustainable? Balance sheets can be hard to analyze, which is why we’ve done it for you. Check out our financial health checks here.
Other High-Performing Stocks: Are there other stocks that provide better prospects with proven track records? Explore our free list of these great stocks here.
NB: Figures in this article are calculated using data from the trailing twelve months from 30 June 2018. This may not be consistent with full year annual report figures.
To help readers see past the short term volatility of the financial market, we aim to bring you a long-term focused research analysis purely driven by fundamental data. Note that our analysis does not factor in the latest price-sensitive company announcements.
The author is an independent contributor and at the time of publication had no position in the stocks mentioned. For errors that warrant correction please contact the editor at editorial-team@simplywallst.com.
