
 Yahoo Finance
 What Does Roots Corporation's (TSE:ROOT) Balance Sheet Tell Us About It?

Want to participate in a short research study? Help shape the future of investing tools and you could win a $250 gift card!
Investors are always looking for growth in small-cap stocks like Roots Corporation (TSE:ROOT), with a market cap of CA$149m. However, an important fact which most ignore is: how financially healthy is the business? Understanding the company's financial health becomes essential, since poor capital management may bring about bankruptcies, which occur at a higher rate for small-caps. We'll look at some basic checks that can form a snapshot the company’s financial strength. However, this is just a partial view of the stock, and I’d encourage you to dig deeper yourself into ROOT here.
Does ROOT Produce Much Cash Relative To Its Debt?
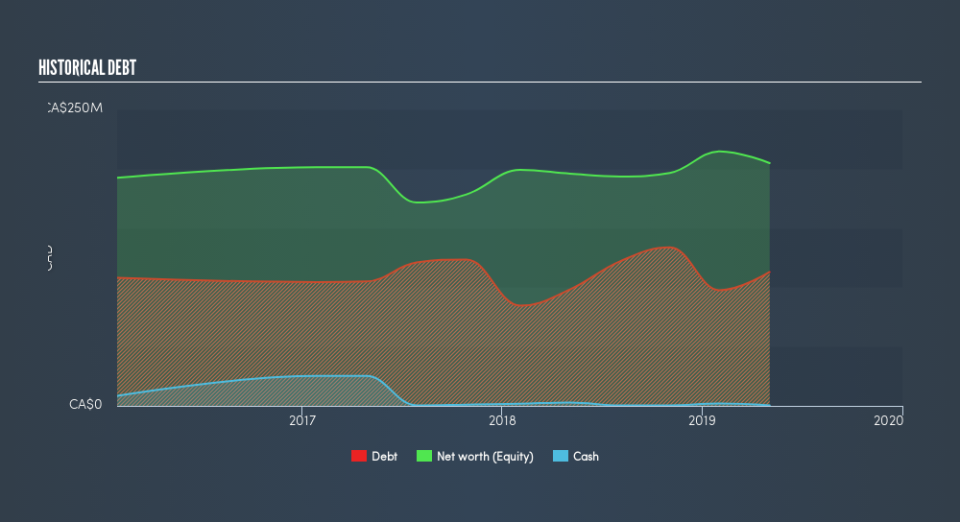
ROOT has built up its total debt levels in the last twelve months, from CA$99m to CA$261m , which accounts for long term debt. With this rise in debt, the current cash and short-term investment levels stands at CA$495k to keep the business going. On top of this, ROOT has produced CA$23m in operating cash flow over the same time period, resulting in an operating cash to total debt ratio of 8.8%, indicating that ROOT’s current level of operating cash is not high enough to cover debt.
Can ROOT meet its short-term obligations with the cash in hand?
With current liabilities at CA$68m, it appears that the company may not have an easy time meeting these commitments with a current assets level of CA$59m, leading to a current ratio of 0.88x. The current ratio is calculated by dividing current assets by current liabilities.
Does ROOT face the risk of succumbing to its debt-load?
With debt reaching 55% of equity, ROOT may be thought of as relatively highly levered. This is somewhat unusual for small-caps companies, since lenders are often hesitant to provide attractive interest rates to less-established businesses. We can check to see whether ROOT is able to meet its debt obligations by looking at the net interest coverage ratio. A company generating earnings before interest and tax (EBIT) at least three times its net interest payments is considered financially sound. In ROOT's, case, the ratio of 3.04x suggests that interest is appropriately covered, which means that lenders may be willing to lend out more funding as ROOT’s high interest coverage is seen as responsible and safe practice.
Next Steps:
Although ROOT’s debt level is towards the higher end of the spectrum, its cash flow coverage seems adequate to meet debt obligations which means its debt is being efficiently utilised. But, its low liquidity raises concerns over whether current asset management practices are properly implemented for the small-cap. I admit this is a fairly basic analysis for ROOT's financial health. Other important fundamentals need to be considered alongside. I recommend you continue to research Roots to get a more holistic view of the stock by looking at:
Future Outlook: What are well-informed industry analysts predicting for ROOT’s future growth? Take a look at our free research report of analyst consensus for ROOT’s outlook.
Valuation: What is ROOT worth today? Is the stock undervalued, even when its growth outlook is factored into its intrinsic value? The intrinsic value infographic in our free research report helps visualize whether ROOT is currently mispriced by the market.
Other High-Performing Stocks: Are there other stocks that provide better prospects with proven track records? Explore our free list of these great stocks here.
We aim to bring you long-term focused research analysis driven by fundamental data. Note that our analysis may not factor in the latest price-sensitive company announcements or qualitative material.
If you spot an error that warrants correction, please contact the editor at editorial-team@simplywallst.com. This article by Simply Wall St is general in nature. It does not constitute a recommendation to buy or sell any stock, and does not take account of your objectives, or your financial situation. Simply Wall St has no position in the stocks mentioned. Thank you for reading.
