
 Yahoo Finance
 Does Regis Healthcare Limited (ASX:REG) Have A Good P/E Ratio?

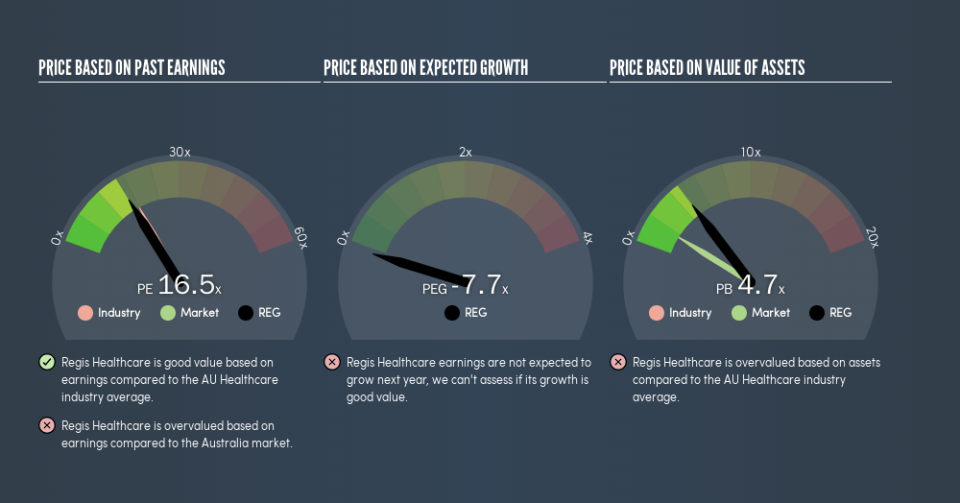
This article is written for those who want to get better at using price to earnings ratios (P/E ratios). To keep it practical, we'll show how Regis Healthcare Limited's (ASX:REG) P/E ratio could help you assess the value on offer. Regis Healthcare has a P/E ratio of 16.46, based on the last twelve months. In other words, at today's prices, investors are paying A$16.46 for every A$1 in prior year profit.
View our latest analysis for Regis Healthcare
How Do I Calculate A Price To Earnings Ratio?
The formula for P/E is:
Price to Earnings Ratio = Price per Share ÷ Earnings per Share (EPS)
Or for Regis Healthcare:
P/E of 16.46 = A$2.76 ÷ A$0.17 (Based on the year to December 2018.)
Is A High Price-to-Earnings Ratio Good?
A higher P/E ratio means that investors are paying a higher price for each A$1 of company earnings. All else being equal, it's better to pay a low price -- but as Warren Buffett said, 'It's far better to buy a wonderful company at a fair price than a fair company at a wonderful price.'
How Does Regis Healthcare's P/E Ratio Compare To Its Peers?
The P/E ratio indicates whether the market has higher or lower expectations of a company. If you look at the image below, you can see Regis Healthcare has a lower P/E than the average (17.9) in the healthcare industry classification.
This suggests that market participants think Regis Healthcare will underperform other companies in its industry. While current expectations are low, the stock could be undervalued if the situation is better than the market assumes. If you consider the stock interesting, further research is recommended. For example, I often monitor director buying and selling.
How Growth Rates Impact P/E Ratios
Companies that shrink earnings per share quickly will rapidly decrease the 'E' in the equation. That means unless the share price falls, the P/E will increase in a few years. A higher P/E should indicate the stock is expensive relative to others -- and that may encourage shareholders to sell.
Regis Healthcare's earnings per share fell by 12% in the last twelve months. But EPS is up 114% over the last 5 years. And EPS is down 11% a year, over the last 3 years. This might lead to low expectations.
Remember: P/E Ratios Don't Consider The Balance Sheet
One drawback of using a P/E ratio is that it considers market capitalization, but not the balance sheet. In other words, it does not consider any debt or cash that the company may have on the balance sheet. In theory, a company can lower its future P/E ratio by using cash or debt to invest in growth.
While growth expenditure doesn't always pay off, the point is that it is a good option to have; but one that the P/E ratio ignores.
Regis Healthcare's Balance Sheet
Regis Healthcare's net debt equates to 40% of its market capitalization. While it's worth keeping this in mind, it isn't a worry.
The Bottom Line On Regis Healthcare's P/E Ratio
Regis Healthcare's P/E is 16.5 which is about average (16.2) in the AU market. When you consider the lack of EPS growth last year (along with some debt), it seems the market is optimistic about the future for the business.
When the market is wrong about a stock, it gives savvy investors an opportunity. If the reality for a company is better than it expects, you can make money by buying and holding for the long term. So this free report on the analyst consensus forecasts could help you make a master move on this stock.
Of course, you might find a fantastic investment by looking at a few good candidates. So take a peek at this free list of companies with modest (or no) debt, trading on a P/E below 20.
We aim to bring you long-term focused research analysis driven by fundamental data. Note that our analysis may not factor in the latest price-sensitive company announcements or qualitative material.
If you spot an error that warrants correction, please contact the editor at editorial-team@simplywallst.com. This article by Simply Wall St is general in nature. It does not constitute a recommendation to buy or sell any stock, and does not take account of your objectives, or your financial situation. Simply Wall St has no position in the stocks mentioned. Thank you for reading.
