
 Yahoo Finance
 What Does Qube Holdings Limited's (ASX:QUB) Balance Sheet Tell Us About It?

Want to participate in a short research study? Help shape the future of investing tools and you could win a $250 gift card!
Qube Holdings Limited (ASX:QUB) is a small-cap stock with a market capitalization of AU$5.0b. While investors primarily focus on the growth potential and competitive landscape of the small-cap companies, they end up ignoring a key aspect, which could be the biggest threat to its existence: its financial health. Why is it important? Evaluating financial health as part of your investment thesis is vital, as mismanagement of capital can lead to bankruptcies, which occur at a higher rate for small-caps. Let's work through some financial health checks you may wish to consider if you're interested in this stock. However, potential investors would need to take a closer look, and I recommend you dig deeper yourself into QUB here.
Does QUB Produce Much Cash Relative To Its Debt?
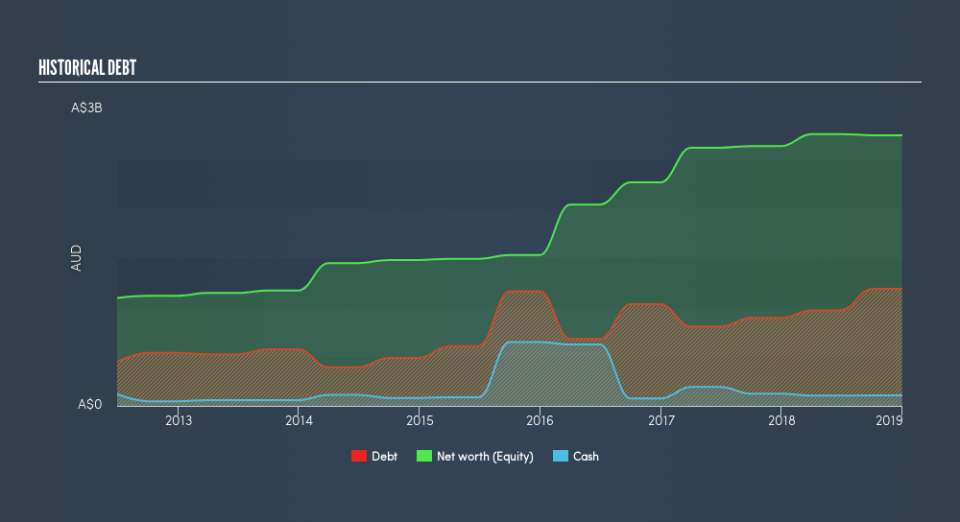
Over the past year, QUB has ramped up its debt from AU$891m to AU$1.2b – this includes long-term debt. With this increase in debt, QUB's cash and short-term investments stands at AU$107m to keep the business going. On top of this, QUB has generated cash from operations of AU$232m in the last twelve months, resulting in an operating cash to total debt ratio of 20%, meaning that QUB’s operating cash is less than its debt.
Can QUB meet its short-term obligations with the cash in hand?
With current liabilities at AU$312m, it appears that the company has been able to meet these commitments with a current assets level of AU$453m, leading to a 1.45x current account ratio. The current ratio is calculated by dividing current assets by current liabilities. Usually, for Infrastructure companies, this is a suitable ratio since there is a bit of a cash buffer without leaving too much capital in a low-return environment.
Is QUB’s debt level acceptable?
With a debt-to-equity ratio of 43%, QUB can be considered as an above-average leveraged company. This is a bit unusual for a small-cap stock, since they generally have a harder time borrowing than large more established companies. No matter how high the company’s debt, if it can easily cover the interest payments, it’s considered to be efficient with its use of excess leverage. A company generating earnings before interest and tax (EBIT) at least three times its net interest payments is considered financially sound. In QUB's case, the ratio of 11.18x suggests that interest is comfortably covered, which means that lenders may be willing to lend out more funding as QUB’s high interest coverage is seen as responsible and safe practice.
Next Steps:
QUB’s high cash coverage means that, although its debt levels are high, the company is able to utilise its borrowings efficiently in order to generate cash flow. This may mean this is an optimal capital structure for the business, given that it is also meeting its short-term commitment. Keep in mind I haven't considered other factors such as how QUB has been performing in the past. I suggest you continue to research Qube Holdings to get a more holistic view of the small-cap by looking at:
Future Outlook: What are well-informed industry analysts predicting for QUB’s future growth? Take a look at our free research report of analyst consensus for QUB’s outlook.
Valuation: What is QUB worth today? Is the stock undervalued, even when its growth outlook is factored into its intrinsic value? The intrinsic value infographic in our free research report helps visualize whether QUB is currently mispriced by the market.
Other High-Performing Stocks: Are there other stocks that provide better prospects with proven track records? Explore our free list of these great stocks here.
We aim to bring you long-term focused research analysis driven by fundamental data. Note that our analysis may not factor in the latest price-sensitive company announcements or qualitative material.
If you spot an error that warrants correction, please contact the editor at editorial-team@simplywallst.com. This article by Simply Wall St is general in nature. It does not constitute a recommendation to buy or sell any stock, and does not take account of your objectives, or your financial situation. Simply Wall St has no position in the stocks mentioned. Thank you for reading.
