
 Yahoo Finance
 Does Ollie’s Bargain Outlet Holdings, Inc.’s (NASDAQ:OLLI) ROCE Reflect Well On The Business?

Want to participate in a short research study? Help shape the future of investing tools and receive a $20 prize!
Today we’ll look at Ollie’s Bargain Outlet Holdings, Inc. (NASDAQ:OLLI) and reflect on its potential as an investment. To be precise, we’ll consider its Return On Capital Employed (ROCE), as that will inform our view of the quality of the business.
First, we’ll go over how we calculate ROCE. Second, we’ll look at its ROCE compared to similar companies. Finally, we’ll look at how its current liabilities affect its ROCE.
Return On Capital Employed (ROCE): What is it?
ROCE measures the ‘return’ (pre-tax profit) a company generates from capital employed in its business. In general, businesses with a higher ROCE are usually better quality. Overall, it is a valuable metric that has its flaws. Renowned investment researcher Michael Mauboussin has suggested that a high ROCE can indicate that ‘one dollar invested in the company generates value of more than one dollar’.
So, How Do We Calculate ROCE?
Analysts use this formula to calculate return on capital employed:
Return on Capital Employed = Earnings Before Interest and Tax (EBIT) ÷ (Total Assets – Current Liabilities)
Or for Ollie’s Bargain Outlet Holdings:
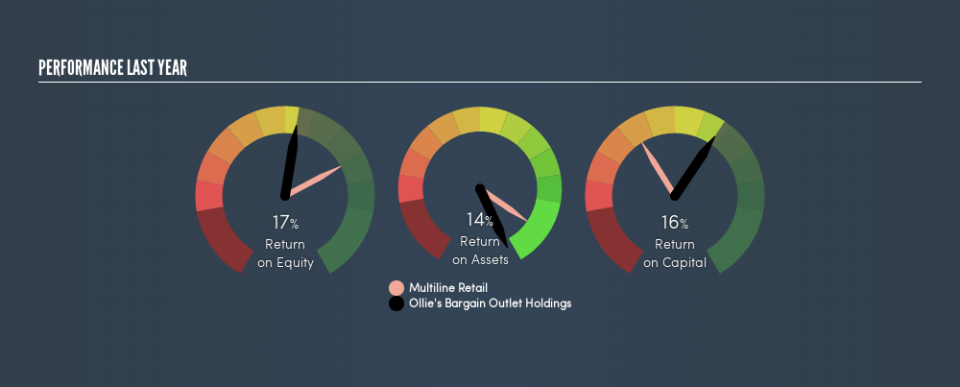
0.16 = US$136m ÷ (US$1.1b – US$170m) (Based on the trailing twelve months to November 2018.)
Therefore, Ollie’s Bargain Outlet Holdings has an ROCE of 16%.
See our latest analysis for Ollie’s Bargain Outlet Holdings
Is Ollie’s Bargain Outlet Holdings’s ROCE Good?
When making comparisons between similar businesses, investors may find ROCE useful. Using our data, Ollie’s Bargain Outlet Holdings’s ROCE appears to be around the 16% average of the Multiline Retail industry. Independently of how Ollie’s Bargain Outlet Holdings compares to its industry, its ROCE in absolute terms appears decent, and the company may be worthy of closer investigation.
As we can see, Ollie’s Bargain Outlet Holdings currently has an ROCE of 16% compared to its ROCE 3 years ago, which was 8.2%. This makes us think the business might be improving.
Remember that this metric is backwards looking – it shows what has happened in the past, and does not accurately predict the future. ROCE can be misleading for companies in cyclical industries, with returns looking impressive during the boom times, but very weak during the busts. ROCE is only a point-in-time measure. What happens in the future is pretty important for investors, so we have prepared a free report on analyst forecasts for Ollie’s Bargain Outlet Holdings.
What Are Current Liabilities, And How Do They Affect Ollie’s Bargain Outlet Holdings’s ROCE?
Current liabilities include invoices, such as supplier payments, short-term debt, or a tax bill, that need to be paid within 12 months. The ROCE equation subtracts current liabilities from capital employed, so a company with a lot of current liabilities appears to have less capital employed, and a higher ROCE than otherwise. To check the impact of this, we calculate if a company has high current liabilities relative to its total assets.
Ollie’s Bargain Outlet Holdings has total assets of US$1.1b and current liabilities of US$170m. As a result, its current liabilities are equal to approximately 15% of its total assets. Current liabilities are minimal, limiting the impact on ROCE.
What We Can Learn From Ollie’s Bargain Outlet Holdings’s ROCE
This is good to see, and with a sound ROCE, Ollie’s Bargain Outlet Holdings could be worth a closer look. Of course you might be able to find a better stock than Ollie’s Bargain Outlet Holdings. So you may wish to see this free collection of other companies that have grown earnings strongly.
For those who like to find winning investments this free list of growing companies with recent insider purchasing, could be just the ticket.
We aim to bring you long-term focused research analysis driven by fundamental data. Note that our analysis may not factor in the latest price-sensitive company announcements or qualitative material.
If you spot an error that warrants correction, please contact the editor at editorial-team@simplywallst.com. This article by Simply Wall St is general in nature. It does not constitute a recommendation to buy or sell any stock, and does not take account of your objectives, or your financial situation. Simply Wall St has no position in the stocks mentioned. On rare occasion, data errors may occur. Thank you for reading.
