
 Yahoo Finance
 Does NZME (NZSE:NZM) Have The Makings Of A Multi-Bagger?

What are the early trends we should look for to identify a stock that could multiply in value over the long term? Firstly, we'll want to see a proven return on capital employed (ROCE) that is increasing, and secondly, an expanding base of capital employed. Ultimately, this demonstrates that it's a business that is reinvesting profits at increasing rates of return. So on that note, NZME (NZSE:NZM) looks quite promising in regards to its trends of return on capital.
What is Return On Capital Employed (ROCE)?
Just to clarify if you're unsure, ROCE is a metric for evaluating how much pre-tax income (in percentage terms) a company earns on the capital invested in its business. Analysts use this formula to calculate it for NZME:
Return on Capital Employed = Earnings Before Interest and Tax (EBIT) ÷ (Total Assets - Current Liabilities)
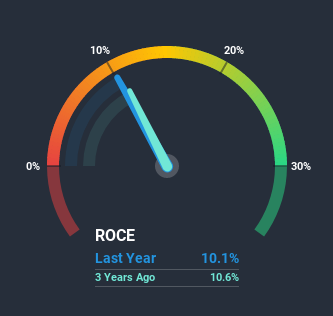
0.10 = NZ$28m ÷ (NZ$339m - NZ$59m) (Based on the trailing twelve months to June 2020).
Thus, NZME has an ROCE of 10%. On its own, that's a standard return, however it's much better than the 4.8% generated by the Media industry.
Check out our latest analysis for NZME
Above you can see how the current ROCE for NZME compares to its prior returns on capital, but there's only so much you can tell from the past. If you'd like, you can check out the forecasts from the analysts covering NZME here for free.
What The Trend Of ROCE Can Tell Us
You'd find it hard not to be impressed with the ROCE trend at NZME. The figures show that over the last five years, returns on capital have grown by 33%. That's not bad because this tells for every dollar invested (capital employed), the company is increasing the amount earned from that dollar. Speaking of capital employed, the company is actually utilizing 67% less than it was five years ago, which can be indicative of a business that's improving its efficiency. NZME may be selling some assets so it's worth investigating if the business has plans for future investments to increase returns further still.
One more thing to note, NZME has decreased current liabilities to 17% of total assets over this period, which effectively reduces the amount of funding from suppliers or short-term creditors. So this improvement in ROCE has come from the business' underlying economics, which is great to see.
The Bottom Line
From what we've seen above, NZME has managed to increase it's returns on capital all the while reducing it's capital base. Astute investors may have an opportunity here because the stock has declined 48% in the last three years. So researching this company further and determining whether or not these trends will continue seems justified.
One more thing, we've spotted 2 warning signs facing NZME that you might find interesting.
For those who like to invest in solid companies, check out this free list of companies with solid balance sheets and high returns on equity.
This article by Simply Wall St is general in nature. It does not constitute a recommendation to buy or sell any stock, and does not take account of your objectives, or your financial situation. We aim to bring you long-term focused analysis driven by fundamental data. Note that our analysis may not factor in the latest price-sensitive company announcements or qualitative material. Simply Wall St has no position in any stocks mentioned.
Have feedback on this article? Concerned about the content? Get in touch with us directly. Alternatively, email editorial-team@simplywallst.com.
