
 Yahoo Finance
 Does NagaCorp Ltd.'s (HKG:3918) P/E Ratio Signal A Buying Opportunity?

Want to participate in a research study? Help shape the future of investing tools and earn a $60 gift card!
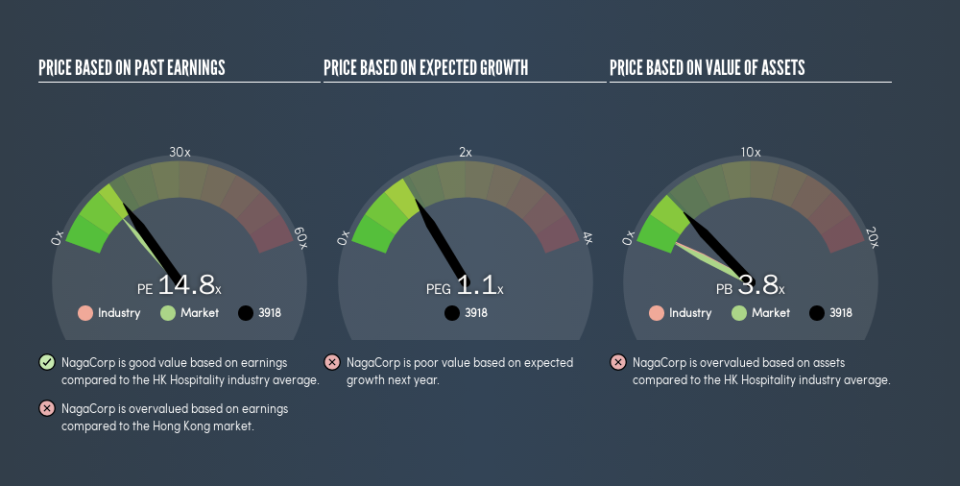
This article is for investors who would like to improve their understanding of price to earnings ratios (P/E ratios). We'll look at NagaCorp Ltd.'s (HKG:3918) P/E ratio and reflect on what it tells us about the company's share price. NagaCorp has a P/E ratio of 14.81, based on the last twelve months. That corresponds to an earnings yield of approximately 6.8%.
See our latest analysis for NagaCorp
How Do You Calculate NagaCorp's P/E Ratio?
The formula for price to earnings is:
Price to Earnings Ratio = Price per Share (in the reporting currency) ÷ Earnings per Share (EPS)
Or for NagaCorp:
P/E of 14.81 = $1.33 (Note: this is the share price in the reporting currency, namely, USD ) ÷ $0.090 (Based on the year to December 2018.)
Is A High Price-to-Earnings Ratio Good?
A higher P/E ratio means that buyers have to pay a higher price for each HK$1 the company has earned over the last year. That is not a good or a bad thing per se, but a high P/E does imply buyers are optimistic about the future.
How Growth Rates Impact P/E Ratios
If earnings fall then in the future the 'E' will be lower. Therefore, even if you pay a low multiple of earnings now, that multiple will become higher in the future. So while a stock may look cheap based on past earnings, it could be expensive based on future earnings.
It's great to see that NagaCorp grew EPS by 13% in the last year. And earnings per share have improved by 4.7% annually, over the last five years. This could arguably justify a relatively high P/E ratio.
How Does NagaCorp's P/E Ratio Compare To Its Peers?
The P/E ratio essentially measures market expectations of a company. As you can see below NagaCorp has a P/E ratio that is fairly close for the average for the hospitality industry, which is 15.3.
That indicates that the market expects NagaCorp will perform roughly in line with other companies in its industry. So if NagaCorp actually outperforms its peers going forward, that should be a positive for the share price. Checking factors such as the tenure of the board and management could help you form your own view on if that will happen.
Remember: P/E Ratios Don't Consider The Balance Sheet
Don't forget that the P/E ratio considers market capitalization. Thus, the metric does not reflect cash or debt held by the company. Hypothetically, a company could reduce its future P/E ratio by spending its cash (or taking on debt) to achieve higher earnings.
Such spending might be good or bad, overall, but the key point here is that you need to look at debt to understand the P/E ratio in context.
How Does NagaCorp's Debt Impact Its P/E Ratio?
Since NagaCorp holds net cash of US$144m, it can spend on growth, justifying a higher P/E ratio than otherwise.
The Verdict On NagaCorp's P/E Ratio
NagaCorp has a P/E of 14.8. That's higher than the average in the HK market, which is 12.2. Its net cash position supports a higher P/E ratio, as does its solid recent earnings growth. So it does not seem strange that the P/E is above average.
Investors should be looking to buy stocks that the market is wrong about. People often underestimate remarkable growth -- so investors can make money when fast growth is not fully appreciated. So this free report on the analyst consensus forecasts could help you make a master move on this stock.
But note: NagaCorp may not be the best stock to buy. So take a peek at this free list of interesting companies with strong recent earnings growth (and a P/E ratio below 20).
We aim to bring you long-term focused research analysis driven by fundamental data. Note that our analysis may not factor in the latest price-sensitive company announcements or qualitative material.
If you spot an error that warrants correction, please contact the editor at editorial-team@simplywallst.com. This article by Simply Wall St is general in nature. It does not constitute a recommendation to buy or sell any stock, and does not take account of your objectives, or your financial situation. Simply Wall St has no position in the stocks mentioned. Thank you for reading.
