
 Yahoo Finance
 Does MYOB Group Limited (ASX:MYO) Generate Enough Cash?

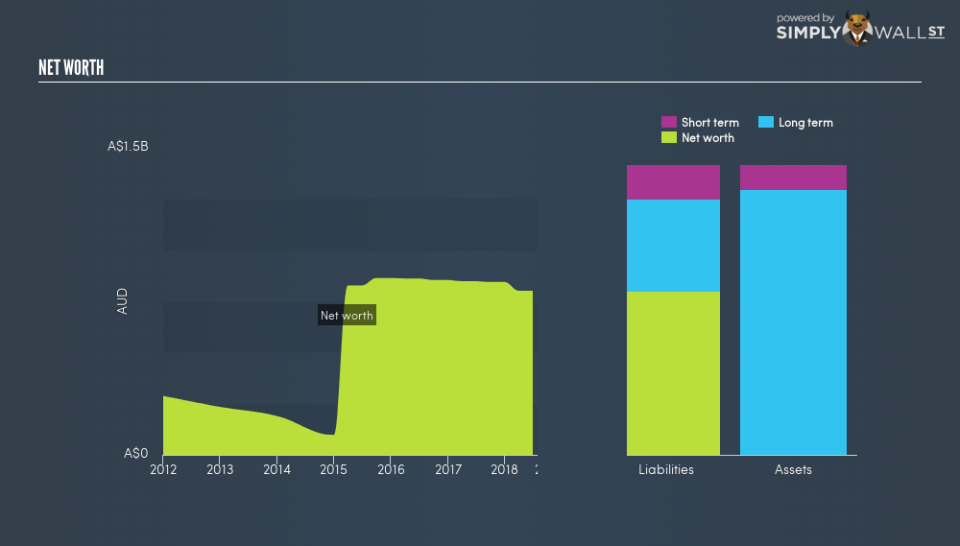
MYOB Group Limited (ASX:MYO) shareholders, and potential investors, need to understand how much cash the business makes from its core operational activities, as well as how much is invested back into the business. This difference directly flows down to how much the stock is worth. Operating in the application software industry, MYO is currently valued at AU$1.74b. I’ve analysed below, the health and outlook of MYO’s cash flow, which will help you understand the stock from a cash standpoint. Cash is an important concept to grasp as an investor, as it directly impacts the value of your shares and the future growth potential of your portfolio.
See our latest analysis for MYOB Group
Is MYOB Group generating enough cash?
MYOB Group’s free cash flow (FCF) is the level of cash flow the business generates from its operational activities, after it reinvests in the company as capital expenditure. This type of expense is needed for MYOB Group to continue to grow, or at least, maintain its current operations.
The two ways to assess whether MYOB Group’s FCF is sufficient, is to compare the FCF yield to the market index yield, as well as determine whether the top-line operating cash flows will continue to grow.
Free Cash Flow = Operating Cash Flows – Net Capital Expenditure
Free Cash Flow Yield = Free Cash Flow / Enterprise Value
where Enterprise Value = Market Capitalisation + Net Debt
MYOB Group’s yield of 3.54% indicates its sub-standard capacity to generate cash, compared to the stock market index as a whole, accounting for the size differential. This means investors are taking on more concentrated risk on MYOB Group but are not being adequately rewarded for doing so.
Does MYOB Group have a favourable cash flow trend?
Another important consideration is whether this return is likely to be maintained over the next couple of years. We can gauge this by looking at MYO’s expected operating cash flows. In the next few years, expected growth for MYO’s operating cash is negative, with operating cash flows expected to decline from its current level of AU$164.2m. This is unfavourable to its future outlook, especially if capital expenditure heads the opposite direction. However, breaking down growth into a year on year basis, MYO ‘s negative growth rate improves each year, from -4.0% next year, to 0.7% in the following year.
Next Steps:
Low free cash flow yield means you are not currently well-compensated for the risk you’re taking on by holding onto MYOB Group relative to a well-diversified market index. Moreover, the stock’s negative growth prospects in terms of cash flow, seems worrisome. Now you know to keep cash flows in mind, I suggest you continue to research MYOB Group to get a better picture of the company by looking at:
Valuation: What is MYO worth today? Is the stock undervalued, even when its growth outlook is factored into its intrinsic value? The intrinsic value infographic in our free research report helps visualize whether MYO is currently mispriced by the market.
Management Team: An experienced management team on the helm increases our confidence in the business – take a look at who sits on MYOB Group’s board and the CEO’s back ground.
Other High-Performing Stocks: If you believe you should cushion your portfolio with something less risky, scroll through our free list of these great stocks here.
To help readers see past the short term volatility of the financial market, we aim to bring you a long-term focused research analysis purely driven by fundamental data. Note that our analysis does not factor in the latest price-sensitive company announcements.
The author is an independent contributor and at the time of publication had no position in the stocks mentioned. For errors that warrant correction please contact the editor at editorial-team@simplywallst.com.
