
 Yahoo Finance
 How Does McMillan Shakespeare's (ASX:MMS) P/E Compare To Its Industry, After The Share Price Drop?

Unfortunately for some shareholders, the McMillan Shakespeare (ASX:MMS) share price has dived 31% in the last thirty days. That drop has capped off a tough year for shareholders, with the share price down 33% in that time.
All else being equal, a share price drop should make a stock more attractive to potential investors. In the long term, share prices tend to follow earnings per share, but in the short term prices bounce around in response to short term factors (which are not always obvious). So, on certain occasions, long term focussed investors try to take advantage of pessimistic expectations to buy shares at a better price. One way to gauge market expectations of a stock is to look at its Price to Earnings Ratio (PE Ratio). A high P/E implies that investors have high expectations of what a company can achieve compared to a company with a low P/E ratio.
See our latest analysis for McMillan Shakespeare
Does McMillan Shakespeare Have A Relatively High Or Low P/E For Its Industry?
McMillan Shakespeare's P/E of 10.88 indicates relatively low sentiment towards the stock. If you look at the image below, you can see McMillan Shakespeare has a lower P/E than the average (14.5) in the professional services industry classification.
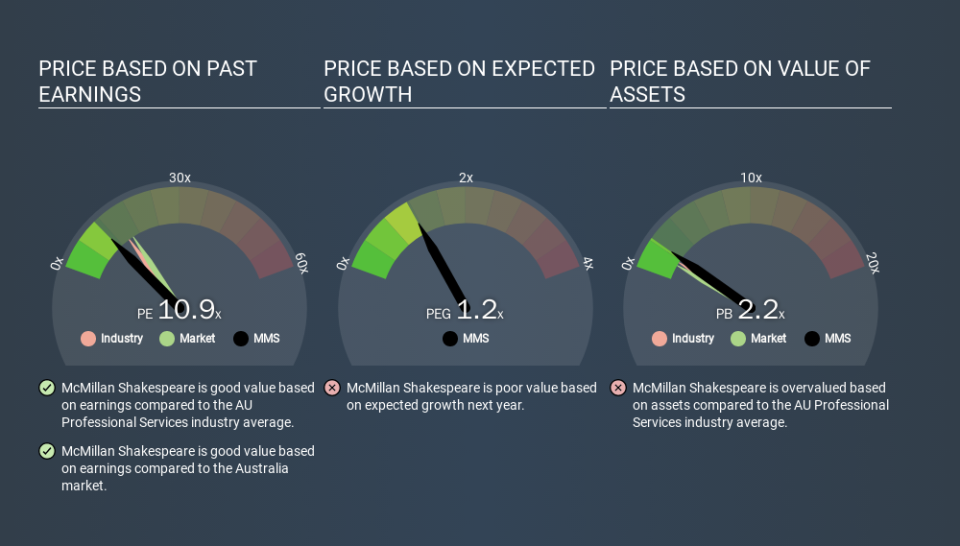
This suggests that market participants think McMillan Shakespeare will underperform other companies in its industry. While current expectations are low, the stock could be undervalued if the situation is better than the market assumes. If you consider the stock interesting, further research is recommended. For example, I often monitor director buying and selling.
How Growth Rates Impact P/E Ratios
Companies that shrink earnings per share quickly will rapidly decrease the 'E' in the equation. Therefore, even if you pay a low multiple of earnings now, that multiple will become higher in the future. A higher P/E should indicate the stock is expensive relative to others -- and that may encourage shareholders to sell.
McMillan Shakespeare increased earnings per share by a whopping 30% last year. In contrast, EPS has decreased by 2.7%, annually, over 5 years.
Don't Forget: The P/E Does Not Account For Debt or Bank Deposits
One drawback of using a P/E ratio is that it considers market capitalization, but not the balance sheet. So it won't reflect the advantage of cash, or disadvantage of debt. Hypothetically, a company could reduce its future P/E ratio by spending its cash (or taking on debt) to achieve higher earnings.
Such expenditure might be good or bad, in the long term, but the point here is that the balance sheet is not reflected by this ratio.
So What Does McMillan Shakespeare's Balance Sheet Tell Us?
McMillan Shakespeare has net debt equal to 42% of its market cap. You'd want to be aware of this fact, but it doesn't bother us.
The Bottom Line On McMillan Shakespeare's P/E Ratio
McMillan Shakespeare trades on a P/E ratio of 10.9, which is below the AU market average of 15.9. The company does have a little debt, and EPS growth was good last year. If it continues to grow, then the current low P/E may prove to be unjustified. Since analysts are predicting growth will continue, one might expect to see a higher P/E so it may be worth looking closer. What can be absolutely certain is that the market has become less optimistic about McMillan Shakespeare over the last month, with the P/E ratio falling from 15.7 back then to 10.9 today. For those who prefer to invest with the flow of momentum, that might be a bad sign, but for a contrarian, it may signal opportunity.
When the market is wrong about a stock, it gives savvy investors an opportunity. As value investor Benjamin Graham famously said, 'In the short run, the market is a voting machine but in the long run, it is a weighing machine. So this free report on the analyst consensus forecasts could help you make a master move on this stock.
Of course, you might find a fantastic investment by looking at a few good candidates. So take a peek at this free list of companies with modest (or no) debt, trading on a P/E below 20.
If you spot an error that warrants correction, please contact the editor at editorial-team@simplywallst.com. This article by Simply Wall St is general in nature. It does not constitute a recommendation to buy or sell any stock, and does not take account of your objectives, or your financial situation. Simply Wall St has no position in the stocks mentioned.
We aim to bring you long-term focused research analysis driven by fundamental data. Note that our analysis may not factor in the latest price-sensitive company announcements or qualitative material. Thank you for reading.
