
 Yahoo Finance
 Does Market Volatility Impact ManTech International Corporation's (NASDAQ:MANT) Share Price?

If you're interested in ManTech International Corporation (NASDAQ:MANT), then you might want to consider its beta (a measure of share price volatility) in order to understand how the stock could impact your portfolio. Volatility is considered to be a measure of risk in modern finance theory. Investors may think of volatility as falling into two main categories. First, we have company specific volatility, which is the price gyrations of an individual stock. Holding at least 8 stocks can reduce this kind of risk across a portfolio. The second type is the broader market volatility, which you cannot diversify away, since it arises from macroeconomic factors which directly affects all the stocks on the market.
Some stocks mimic the volatility of the market quite closely, while others demonstrate muted, exagerrated or uncorrelated price movements. Beta can be a useful tool to understand how much a stock is influenced by market risk (volatility). However, Warren Buffett said 'volatility is far from synonymous with risk' in his 2014 letter to investors. So, while useful, beta is not the only metric to consider. To use beta as an investor, you must first understand that the overall market has a beta of one. A stock with a beta below one is either less volatile than the market, or more volatile but not corellated with the overall market. In comparison a stock with a beta of over one tends to be move in a similar direction to the market in the long term, but with greater changes in price.
View our latest analysis for ManTech International
What does MANT's beta value mean to investors?
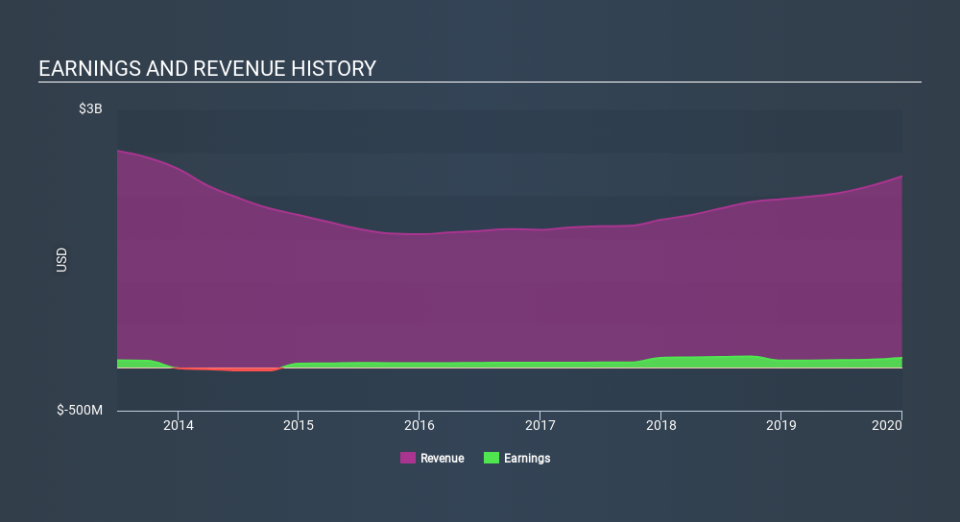
Zooming in on ManTech International, we see it has a five year beta of 0.84. This is below 1, so historically its share price has been rather independent from the market. This means that -- if history is a guide -- buying the stock would reduce the impact of overall market volatility in many portfolios (depending on the beta of the portfolio, of course). Share price volatility is well worth considering, but most long term investors consider the history of revenue and earnings growth to be more important. Take a look at how ManTech International fares in that regard, below.
Could MANT's size cause it to be more volatile?
ManTech International is a fairly large company. It has a market capitalisation of US$3.1b, which means it is probably on the radar of most investors. It is a little unusual to see big companies like this trade on low beta values. Oftentimes there is some other clear influence on the share price, overshadowing market volatility.
What this means for you:
Since ManTech International is not heavily influenced by market moves, its share price is probably far more dependent on company specific developments. It could pay to take a closer look at metrics such as revenue growth, earnings growth, and debt. This article aims to educate investors about beta values, but it's well worth looking at important company-specific fundamentals such as ManTech International’s financial health and performance track record. I urge you to continue your research by taking a look at the following:
Future Outlook: What are well-informed industry analysts predicting for MANT’s future growth? Take a look at our free research report of analyst consensus for MANT’s outlook.
Past Track Record: Has MANT been consistently performing well irrespective of the ups and downs in the market? Go into more detail in the past performance analysis and take a look at the free visual representations of MANT's historicals for more clarity.
Other Interesting Stocks: It's worth checking to see how MANT measures up against other companies on valuation. You could start with this free list of prospective options.
If you spot an error that warrants correction, please contact the editor at editorial-team@simplywallst.com. This article by Simply Wall St is general in nature. It does not constitute a recommendation to buy or sell any stock, and does not take account of your objectives, or your financial situation. Simply Wall St has no position in the stocks mentioned.
We aim to bring you long-term focused research analysis driven by fundamental data. Note that our analysis may not factor in the latest price-sensitive company announcements or qualitative material. Thank you for reading.
