
 Yahoo Finance
 Does The Market Have A Low Tolerance For Barnes Group Inc.'s (NYSE:B) Mixed Fundamentals?
It is hard to get excited after looking at Barnes Group's (NYSE:B) recent performance, when its stock has declined 16% over the past three months. It is possible that the markets have ignored the company's differing financials and decided to lean-in to the negative sentiment. Stock prices are usually driven by a company’s financial performance over the long term, and therefore we decided to pay more attention to the company's financial performance. Particularly, we will be paying attention to Barnes Group's ROE today.
Return on Equity or ROE is a test of how effectively a company is growing its value and managing investors’ money. Put another way, it reveals the company's success at turning shareholder investments into profits.
Check out our latest analysis for Barnes Group
How Do You Calculate Return On Equity?
The formula for return on equity is:
Return on Equity = Net Profit (from continuing operations) ÷ Shareholders' Equity
So, based on the above formula, the ROE for Barnes Group is:
5.5% = US$77m ÷ US$1.4b (Based on the trailing twelve months to June 2021).
The 'return' is the yearly profit. That means that for every $1 worth of shareholders' equity, the company generated $0.06 in profit.
What Is The Relationship Between ROE And Earnings Growth?
We have already established that ROE serves as an efficient profit-generating gauge for a company's future earnings. Depending on how much of these profits the company reinvests or "retains", and how effectively it does so, we are then able to assess a company’s earnings growth potential. Assuming everything else remains unchanged, the higher the ROE and profit retention, the higher the growth rate of a company compared to companies that don't necessarily bear these characteristics.
Barnes Group's Earnings Growth And 5.5% ROE
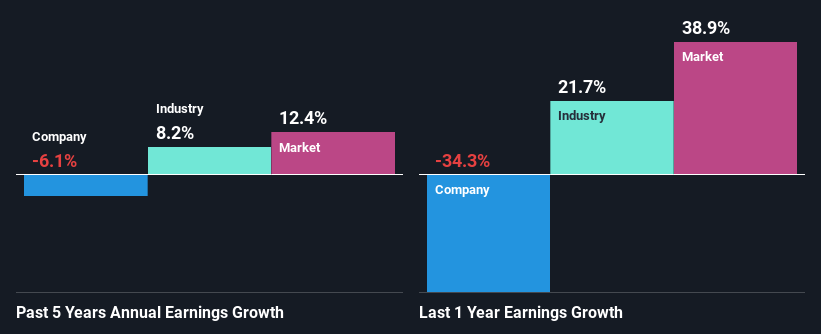
At first glance, Barnes Group's ROE doesn't look very promising. We then compared the company's ROE to the broader industry and were disappointed to see that the ROE is lower than the industry average of 11%. For this reason, Barnes Group's five year net income decline of 6.1% is not surprising given its lower ROE. However, there could also be other factors causing the earnings to decline. For instance, the company has a very high payout ratio, or is faced with competitive pressures.
So, as a next step, we compared Barnes Group's performance against the industry and were disappointed to discover that while the company has been shrinking its earnings, the industry has been growing its earnings at a rate of 8.2% in the same period.
Earnings growth is a huge factor in stock valuation. What investors need to determine next is if the expected earnings growth, or the lack of it, is already built into the share price. By doing so, they will have an idea if the stock is headed into clear blue waters or if swampy waters await. What is B worth today? The intrinsic value infographic in our free research report helps visualize whether B is currently mispriced by the market.
Is Barnes Group Efficiently Re-investing Its Profits?
Despite having a normal three-year median payout ratio of 28% (where it is retaining 72% of its profits), Barnes Group has seen a decline in earnings as we saw above. So there could be some other explanations in that regard. For instance, the company's business may be deteriorating.
In addition, Barnes Group has been paying dividends over a period of at least ten years suggesting that keeping up dividend payments is way more important to the management even if it comes at the cost of business growth. Based on the latest analysts' estimates, we found that the company's future payout ratio over the next three years is expected to hold steady at 26%. However, Barnes Group's ROE is predicted to rise to 8.9% despite there being no anticipated change in its payout ratio.
Conclusion
Overall, we have mixed feelings about Barnes Group. While the company does have a high rate of profit retention, its low rate of return is probably hampering its earnings growth. That being so, the latest industry analyst forecasts show that the analysts are expecting to see a huge improvement in the company's earnings growth rate. To know more about the company's future earnings growth forecasts take a look at this free report on analyst forecasts for the company to find out more.
This article by Simply Wall St is general in nature. We provide commentary based on historical data and analyst forecasts only using an unbiased methodology and our articles are not intended to be financial advice. It does not constitute a recommendation to buy or sell any stock, and does not take account of your objectives, or your financial situation. We aim to bring you long-term focused analysis driven by fundamental data. Note that our analysis may not factor in the latest price-sensitive company announcements or qualitative material. Simply Wall St has no position in any stocks mentioned.
Have feedback on this article? Concerned about the content? Get in touch with us directly. Alternatively, email editorial-team (at) simplywallst.com.
