
 Yahoo Finance
 Does Marenica Energy Limited (ASX:MEY) Have A Particularly Volatile Share Price?

If you own shares in Marenica Energy Limited (ASX:MEY) then it's worth thinking about how it contributes to the volatility of your portfolio, overall. In finance, Beta is a measure of volatility. Modern finance theory considers volatility to be a measure of risk, and there are two main types of price volatility. The first category is company specific volatility. This can be dealt with by limiting your exposure to any particular stock. The second type is the broader market volatility, which you cannot diversify away, since it arises from macroeconomic factors which directly affects all the stocks on the market.
Some stocks mimic the volatility of the market quite closely, while others demonstrate muted, exagerrated or uncorrelated price movements. Some investors use beta as a measure of how much a certain stock is impacted by market risk (volatility). While we should keep in mind that Warren Buffett has cautioned that 'Volatility is far from synonymous with risk', beta is still a useful factor to consider. To make good use of it you must first know that the beta of the overall market is one. A stock with a beta below one is either less volatile than the market, or more volatile but not corellated with the overall market. In comparison a stock with a beta of over one tends to be move in a similar direction to the market in the long term, but with greater changes in price.
See our latest analysis for Marenica Energy
What we can learn from MEY's beta value
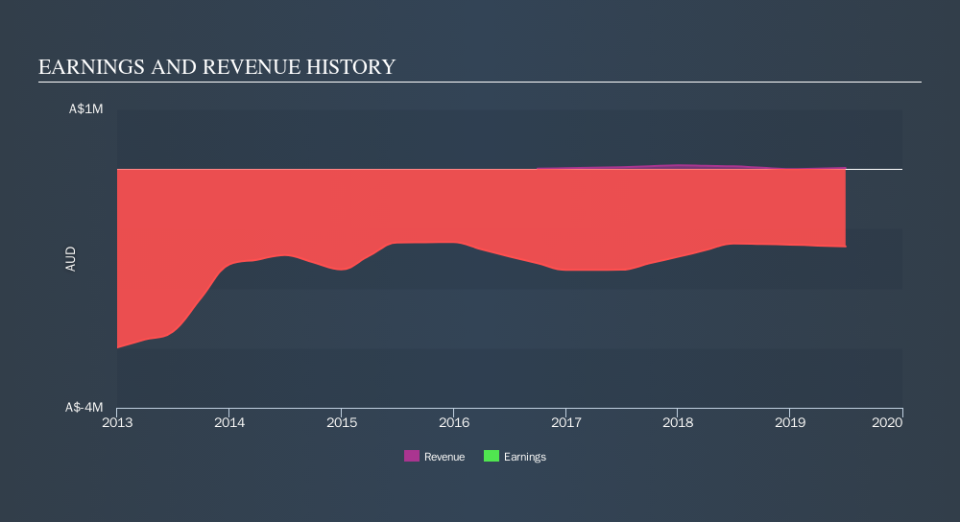
Zooming in on Marenica Energy, we see it has a five year beta of 1.10. This is above 1, so historically its share price has been influenced by the broader volatility of the stock market. If the past is any guide, we would expect that Marenica Energy shares will rise quicker than the markets in times of optimism, but fall faster in times of pessimism. Share price volatility is well worth considering, but most long term investors consider the history of revenue and earnings growth to be more important. Take a look at how Marenica Energy fares in that regard, below.
Does MEY's size influence the expected beta?
Marenica Energy is a noticeably small company, with a market capitalisation of AU$8.5m. Most companies this size are not always actively traded. Relatively few investors can influence the price of a smaller company, compared to a large company. This could explain the high beta value, in this case.
What this means for you:
Since Marenica Energy has a reasonably high beta, it's worth considering why it is so heavily influenced by broader market sentiment. For example, it might be a high growth stock or have a lot of operating leverage in its business model. In order to fully understand whether MEY is a good investment for you, we also need to consider important company-specific fundamentals such as Marenica Energy’s financial health and performance track record. I urge you to continue your research by taking a look at the following:
Past Track Record: Has MEY been consistently performing well irrespective of the ups and downs in the market? Go into more detail in the past performance analysis and take a look at the free visual representations of MEY's historicals for more clarity.
Other High-Performing Stocks: Are there other stocks that provide better prospects with proven track records? Explore our free list of these great stocks here.
We aim to bring you long-term focused research analysis driven by fundamental data. Note that our analysis may not factor in the latest price-sensitive company announcements or qualitative material.
If you spot an error that warrants correction, please contact the editor at editorial-team@simplywallst.com. This article by Simply Wall St is general in nature. It does not constitute a recommendation to buy or sell any stock, and does not take account of your objectives, or your financial situation. Simply Wall St has no position in the stocks mentioned. Thank you for reading.
