
 Yahoo Finance
 What Does Kaman Corporation's (NYSE:KAMN) Balance Sheet Tell Us About It?

Investors are always looking for growth in small-cap stocks like Kaman Corporation (NYSE:KAMN), with a market cap of US$1.7b. However, an important fact which most ignore is: how financially healthy is the business? Assessing first and foremost the financial health is crucial, since poor capital management may bring about bankruptcies, which occur at a higher rate for small-caps. The following basic checks can help you get a picture of the company's balance sheet strength. However, potential investors would need to take a closer look, and I recommend you dig deeper yourself into KAMN here.
KAMN’s Debt (And Cash Flows)
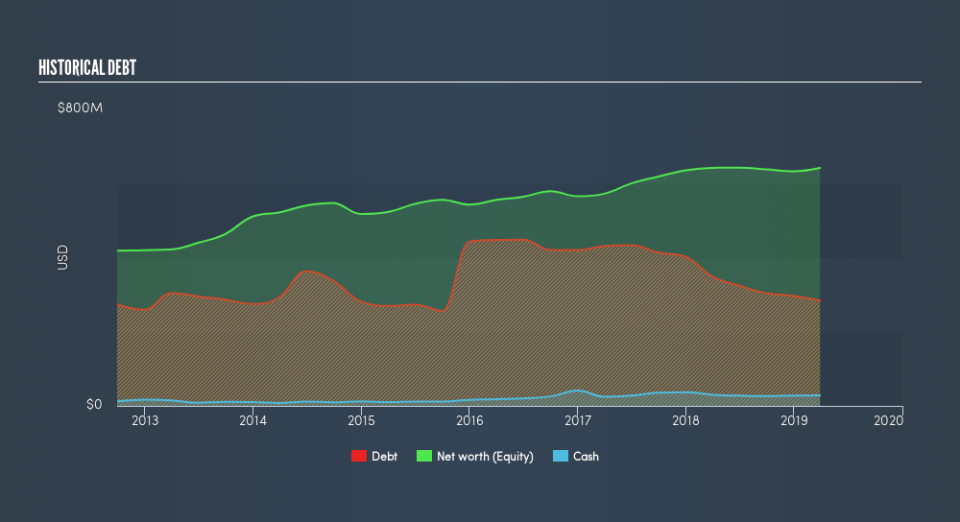
Over the past year, KAMN has ramped up its debt from US$349m to US$382m – this includes long-term debt. With this growth in debt, KAMN currently has US$28m remaining in cash and short-term investments to keep the business going. Additionally, KAMN has generated cash from operations of US$128m in the last twelve months, resulting in an operating cash to total debt ratio of 34%, meaning that KAMN’s current level of operating cash is high enough to cover debt.
Can KAMN meet its short-term obligations with the cash in hand?
With current liabilities at US$318m, the company has maintained a safe level of current assets to meet its obligations, with the current ratio last standing at 2.42x. The current ratio is the number you get when you divide current assets by current liabilities. Generally, for Trade Distributors companies, this is a reasonable ratio since there's a sufficient cash cushion without leaving too much capital idle or in low-earning investments.
Does KAMN face the risk of succumbing to its debt-load?
KAMN is a relatively highly levered company with a debt-to-equity of 46%. This is a bit unusual for a small-cap stock, since they generally have a harder time borrowing than large more established companies. We can test if KAMN’s debt levels are sustainable by measuring interest payments against earnings of a company. Ideally, earnings before interest and tax (EBIT) should cover net interest by at least three times. For KAMN, the ratio of 6.08x suggests that interest is appropriately covered, which means that lenders may be willing to lend out more funding as KAMN’s high interest coverage is seen as responsible and safe practice.
Next Steps:
KAMN’s high cash coverage means that, although its debt levels are high, the company is able to utilise its borrowings efficiently in order to generate cash flow. Since there is also no concerns around KAMN's liquidity needs, this may be its optimal capital structure for the time being. This is only a rough assessment of financial health, and I'm sure KAMN has company-specific issues impacting its capital structure decisions. I recommend you continue to research Kaman to get a more holistic view of the small-cap by looking at:
Future Outlook: What are well-informed industry analysts predicting for KAMN’s future growth? Take a look at our free research report of analyst consensus for KAMN’s outlook.
Valuation: What is KAMN worth today? Is the stock undervalued, even when its growth outlook is factored into its intrinsic value? The intrinsic value infographic in our free research report helps visualize whether KAMN is currently mispriced by the market.
Other High-Performing Stocks: Are there other stocks that provide better prospects with proven track records? Explore our free list of these great stocks here.
We aim to bring you long-term focused research analysis driven by fundamental data. Note that our analysis may not factor in the latest price-sensitive company announcements or qualitative material.
If you spot an error that warrants correction, please contact the editor at editorial-team@simplywallst.com. This article by Simply Wall St is general in nature. It does not constitute a recommendation to buy or sell any stock, and does not take account of your objectives, or your financial situation. Simply Wall St has no position in the stocks mentioned. Thank you for reading.
