
 Yahoo Finance
 What Does K. Wah International Holdings Limited's (HKG:173) Balance Sheet Tell Us About It?

While small-cap stocks, such as K. Wah International Holdings Limited (HKG:173) with its market cap of HK$15b, are popular for their explosive growth, investors should also be aware of their balance sheet to judge whether the company can survive a downturn. Understanding the company's financial health becomes crucial, as mismanagement of capital can lead to bankruptcies, which occur at a higher rate for small-caps. Let's work through some financial health checks you may wish to consider if you're interested in this stock. However, this is just a partial view of the stock, and I suggest you dig deeper yourself into 173 here.
Want to participate in a short research study? Help shape the future of investing tools and you could win a $250 gift card!
Does 173 Produce Much Cash Relative To Its Debt?
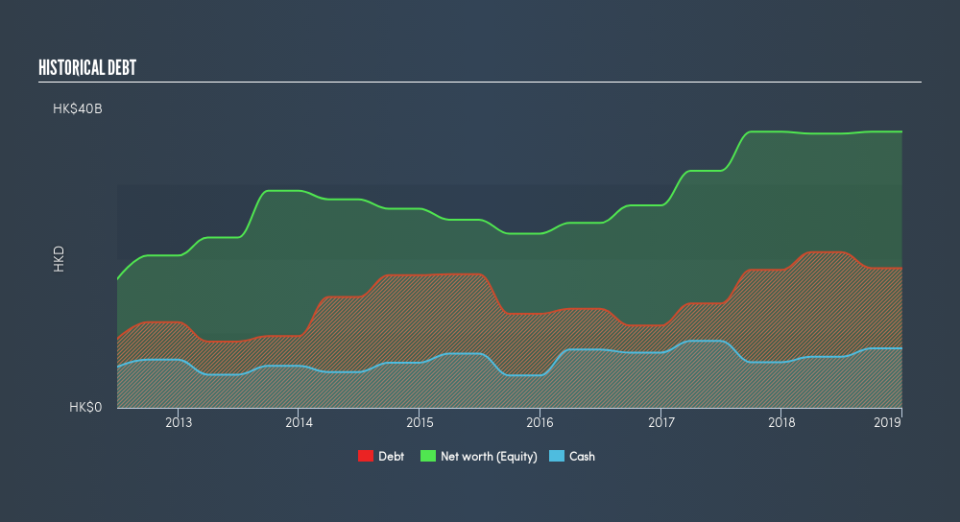
173 has sustained its debt level by about HK$19b over the last 12 months – this includes long-term debt. At this constant level of debt, the current cash and short-term investment levels stands at HK$8.0b to keep the business going. Additionally, 173 has produced HK$1.1b in operating cash flow in the last twelve months, resulting in an operating cash to total debt ratio of 5.7%, indicating that 173’s debt is not covered by operating cash.
Can 173 pay its short-term liabilities?
With current liabilities at HK$13b, the company has maintained a safe level of current assets to meet its obligations, with the current ratio last standing at 3.04x. The current ratio is the number you get when you divide current assets by current liabilities. However, a ratio greater than 3x may be considered by some to be quite high, however this is not necessarily a negative for the company.
Can 173 service its debt comfortably?
173 is a relatively highly levered company with a debt-to-equity of 51%. This is a bit unusual for a small-cap stock, since they generally have a harder time borrowing than large more established companies.
Next Steps:
173’s high cash coverage means that, although its debt levels are high, the company is able to utilise its borrowings efficiently in order to generate cash flow. Since there is also no concerns around 173's liquidity needs, this may be its optimal capital structure for the time being. This is only a rough assessment of financial health, and I'm sure 173 has company-specific issues impacting its capital structure decisions. I recommend you continue to research K. Wah International Holdings to get a more holistic view of the small-cap by looking at:
Future Outlook: What are well-informed industry analysts predicting for 173’s future growth? Take a look at our free research report of analyst consensus for 173’s outlook.
Valuation: What is 173 worth today? Is the stock undervalued, even when its growth outlook is factored into its intrinsic value? The intrinsic value infographic in our free research report helps visualize whether 173 is currently mispriced by the market.
Other High-Performing Stocks: Are there other stocks that provide better prospects with proven track records? Explore our free list of these great stocks here.
We aim to bring you long-term focused research analysis driven by fundamental data. Note that our analysis may not factor in the latest price-sensitive company announcements or qualitative material.
If you spot an error that warrants correction, please contact the editor at editorial-team@simplywallst.com. This article by Simply Wall St is general in nature. It does not constitute a recommendation to buy or sell any stock, and does not take account of your objectives, or your financial situation. Simply Wall St has no position in the stocks mentioned. Thank you for reading.
