
 Yahoo Finance
 Does Incitec Pivot Limited's (ASX:IPL) Debt Level Pose A Problem?

Stocks with market capitalization between $2B and $10B, such as Incitec Pivot Limited (ASX:IPL) with a size of AU$5.3b, do not attract as much attention from the investing community as do the small-caps and large-caps. While they are less talked about as an investment category, mid-cap risk-adjusted returns have generally been better than more commonly focused stocks that fall into the small- or large-cap categories. IPL’s financial liquidity and debt position will be analysed in this article, to get an idea of whether the company can fund opportunities for strategic growth and maintain strength through economic downturns. Remember this is a very top-level look that focuses exclusively on financial health, so I recommend a deeper analysis into IPL here.
Want to participate in a short research study? Help shape the future of investing tools and you could win a $250 gift card!
See our latest analysis for Incitec Pivot
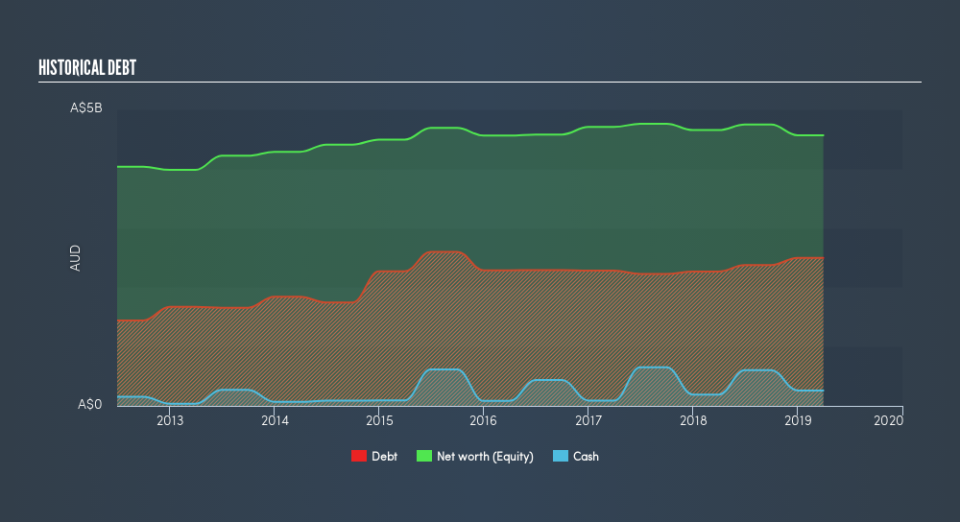
IPL’s Debt (And Cash Flows)
IPL has built up its total debt levels in the last twelve months, from AU$2.3b to AU$2.5b , which accounts for long term debt. With this increase in debt, IPL currently has AU$261m remaining in cash and short-term investments to keep the business going. On top of this, IPL has generated AU$766m in operating cash flow during the same period of time, resulting in an operating cash to total debt ratio of 31%, signalling that IPL’s debt is appropriately covered by operating cash.
Can IPL pay its short-term liabilities?
With current liabilities at AU$2.4b, the company may not have an easy time meeting these commitments with a current assets level of AU$1.4b, leading to a current ratio of 0.58x. The current ratio is the number you get when you divide current assets by current liabilities.
Does IPL face the risk of succumbing to its debt-load?
With a debt-to-equity ratio of 55%, IPL can be considered as an above-average leveraged company. This is not uncommon for a mid-cap company given that debt tends to be lower-cost and at times, more accessible. We can check to see whether IPL is able to meet its debt obligations by looking at the net interest coverage ratio. A company generating earnings before interest and tax (EBIT) at least three times its net interest payments is considered financially sound. In IPL's, case, the ratio of 3.02x suggests that interest is appropriately covered, which means that lenders may be less hesitant to lend out more funding as IPL’s high interest coverage is seen as responsible and safe practice.
Next Steps:
IPL’s high cash coverage means that, although its debt levels are high, the company is able to utilise its borrowings efficiently in order to generate cash flow. But, its low liquidity raises concerns over whether current asset management practices are properly implemented for the mid-cap. Keep in mind I haven't considered other factors such as how IPL has been performing in the past. I suggest you continue to research Incitec Pivot to get a better picture of the stock by looking at:
Future Outlook: What are well-informed industry analysts predicting for IPL’s future growth? Take a look at our free research report of analyst consensus for IPL’s outlook.
Valuation: What is IPL worth today? Is the stock undervalued, even when its growth outlook is factored into its intrinsic value? The intrinsic value infographic in our free research report helps visualize whether IPL is currently mispriced by the market.
Other High-Performing Stocks: Are there other stocks that provide better prospects with proven track records? Explore our free list of these great stocks here.
We aim to bring you long-term focused research analysis driven by fundamental data. Note that our analysis may not factor in the latest price-sensitive company announcements or qualitative material.
If you spot an error that warrants correction, please contact the editor at editorial-team@simplywallst.com. This article by Simply Wall St is general in nature. It does not constitute a recommendation to buy or sell any stock, and does not take account of your objectives, or your financial situation. Simply Wall St has no position in the stocks mentioned. Thank you for reading.
