
 Yahoo Finance
 What does The Home Depot Inc’s (NYSE:HD) Balance Sheet Tell Us About Its Future?

There are a number of reasons that attract investors towards large-cap companies such as The Home Depot Inc (NYSE:HD), with a market cap of US$228.78B. Market participants who are conscious of risk tend to search for large firms, attracted by the prospect of varied revenue sources and strong returns on capital. However, its financial health remains the key to continued success. This article will examine Home Depot’s financial liquidity and debt levels to get an idea of whether the company can deal with cyclical downturns and maintain funds to accommodate strategic spending for future growth. Note that this information is centred entirely on financial health and is a high-level overview, so I encourage you to look further into HD here. View our latest analysis for Home Depot
How does HD’s operating cash flow stack up against its debt?
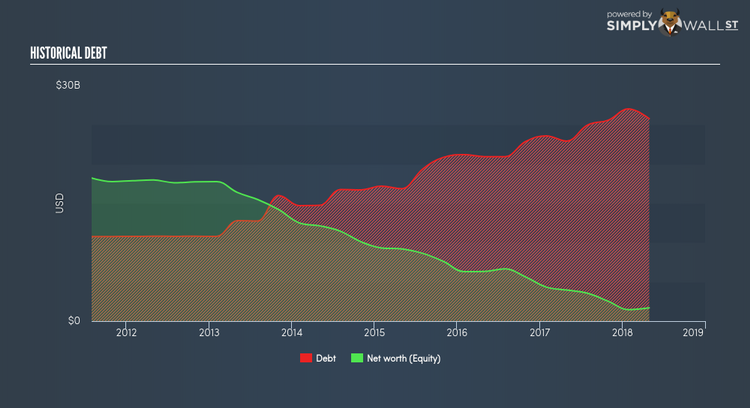
HD’s debt levels surged from US$23.60B to US$27.03B over the last 12 months , which comprises of short- and long-term debt. With this rise in debt, the current cash and short-term investment levels stands at US$3.60B , ready to deploy into the business. Additionally, HD has produced cash from operations of US$12.03B during the same period of time, leading to an operating cash to total debt ratio of 44.51%, meaning that HD’s operating cash is sufficient to cover its debt. This ratio can also be interpreted as a measure of efficiency as an alternative to return on assets. In HD’s case, it is able to generate 0.45x cash from its debt capital.
Does HD’s liquid assets cover its short-term commitments?
With current liabilities at US$16.19B, it appears that the company has been able to meet these commitments with a current assets level of US$18.93B, leading to a 1.17x current account ratio. Generally, for Specialty Retail companies, this is a reasonable ratio since there’s sufficient cash cushion without leaving too much capital idle or in low-earning investments.
Is HD’s debt level acceptable?
Home Depot is a highly levered company given that total debt exceeds equity. This is not unusual for large-caps since debt tends to be less expensive than equity because interest payments are tax deductible. Since large-caps are seen as safer than their smaller constituents, they tend to enjoy lower cost of capital. We can put the sustainability of HD’s debt levels to the test by looking at how well interest payments are covered by earnings. Preferably, earnings before interest and tax (EBIT) should be at least three times as large as net interest. In HD’s case, the ratio of 15x suggests that interest is comfortably covered. Large-cap investments like HD are often believed to be a safe investment due to their ability to pump out ample earnings multiple times its interest payments.
Next Steps:
Although HD’s debt level is towards the higher end of the spectrum, its cash flow coverage seems adequate to meet obligations which means its debt is being efficiently utilised. This may mean this is an optimal capital structure for the business, given that it is also meeting its short-term commitment. Keep in mind I haven’t considered other factors such as how HD has been performing in the past. You should continue to research Home Depot to get a more holistic view of the large-cap by looking at:
Future Outlook: What are well-informed industry analysts predicting for HD’s future growth? Take a look at our free research report of analyst consensus for HD’s outlook.
Valuation: What is HD worth today? Is the stock undervalued, even when its growth outlook is factored into its intrinsic value? The intrinsic value infographic in our free research report helps visualize whether HD is currently mispriced by the market.
Other High-Performing Stocks: Are there other stocks that provide better prospects with proven track records? Explore our free list of these great stocks here.
To help readers see pass the short term volatility of the financial market, we aim to bring you a long-term focused research analysis purely driven by fundamental data. Note that our analysis does not factor in the latest price sensitive company announcements.
The author is an independent contributor and at the time of publication had no position in the stocks mentioned.
