
 Yahoo Finance
 Does Holland Colours N.V.'s (AMS:HOLCO) Weak Fundamentals Mean A Downturn In Its Stock Should Be Expected?
Most readers would already know that Holland Colours' (AMS:HOLCO) stock increased by 7.6% over the past three months. However, in this article, we decided to focus on its weak financials, as long-term fundamentals ultimately dictate market outcomes. Particularly, we will be paying attention to Holland Colours' ROE today.
Return on Equity or ROE is a test of how effectively a company is growing its value and managing investors’ money. In simpler terms, it measures the profitability of a company in relation to shareholder's equity.
See our latest analysis for Holland Colours
How Is ROE Calculated?
The formula for return on equity is:
Return on Equity = Net Profit (from continuing operations) ÷ Shareholders' Equity
So, based on the above formula, the ROE for Holland Colours is:
6.8% = €4.0m ÷ €59m (Based on the trailing twelve months to September 2023).
The 'return' is the amount earned after tax over the last twelve months. Another way to think of that is that for every €1 worth of equity, the company was able to earn €0.07 in profit.
Why Is ROE Important For Earnings Growth?
We have already established that ROE serves as an efficient profit-generating gauge for a company's future earnings. Depending on how much of these profits the company reinvests or "retains", and how effectively it does so, we are then able to assess a company’s earnings growth potential. Assuming all else is equal, companies that have both a higher return on equity and higher profit retention are usually the ones that have a higher growth rate when compared to companies that don't have the same features.
A Side By Side comparison of Holland Colours' Earnings Growth And 6.8% ROE
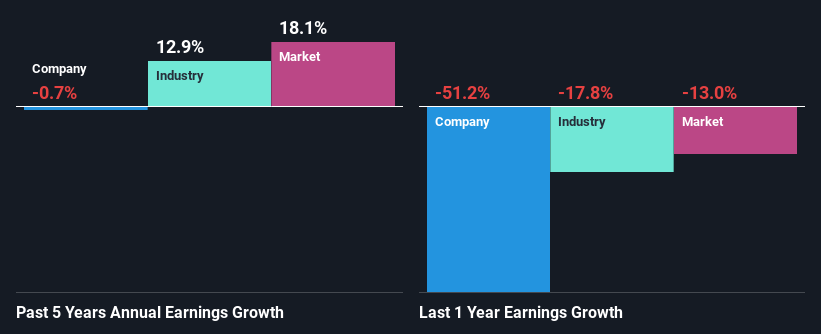
On the face of it, Holland Colours' ROE is not much to talk about. We then compared the company's ROE to the broader industry and were disappointed to see that the ROE is lower than the industry average of 11%. Therefore, Holland Colours' flat earnings over the past five years can possibly be explained by the low ROE amongst other factors.
Next, on comparing with the industry net income growth, we found that the industry grew its earnings by 13% over the last few years.
The basis for attaching value to a company is, to a great extent, tied to its earnings growth. What investors need to determine next is if the expected earnings growth, or the lack of it, is already built into the share price. By doing so, they will have an idea if the stock is headed into clear blue waters or if swampy waters await. If you're wondering about Holland Colours''s valuation, check out this gauge of its price-to-earnings ratio, as compared to its industry.
Is Holland Colours Efficiently Re-investing Its Profits?
The high three-year median payout ratio of 57% (meaning, the company retains only 43% of profits) for Holland Colours suggests that the company's earnings growth was miniscule as a result of paying out a majority of its earnings.
In addition, Holland Colours has been paying dividends over a period of at least ten years suggesting that keeping up dividend payments is way more important to the management even if it comes at the cost of business growth.
Conclusion
In total, we would have a hard think before deciding on any investment action concerning Holland Colours. As a result of its low ROE and lack of much reinvestment into the business, the company has seen a disappointing earnings growth rate. So far, we've only made a quick discussion around the company's earnings growth. You can do your own research on Holland Colours and see how it has performed in the past by looking at this FREE detailed graph of past earnings, revenue and cash flows.
Have feedback on this article? Concerned about the content? Get in touch with us directly. Alternatively, email editorial-team (at) simplywallst.com.
This article by Simply Wall St is general in nature. We provide commentary based on historical data and analyst forecasts only using an unbiased methodology and our articles are not intended to be financial advice. It does not constitute a recommendation to buy or sell any stock, and does not take account of your objectives, or your financial situation. We aim to bring you long-term focused analysis driven by fundamental data. Note that our analysis may not factor in the latest price-sensitive company announcements or qualitative material. Simply Wall St has no position in any stocks mentioned.
